UI for Blazor
Blazor Candlestick Chart
- Use the Blazor Candlestick Chart component to visualize the price fluctuation of financial units.
- Part of the Telerik UI for Blazor library along with 120+ professionally-designed UI components.
- Includes support, documentation, demos, virtual classrooms, Visual Studio Code Extensions and more!

-
Visualize Data with Blazor Candlestick Chart
A Candlestick chart shows data for the movement of the price of a financial unit. It consists of a candle (bar), representing the open and close values, and candlesticks, which represent the highest and lowest values.
Example of Blazor Candlestick chart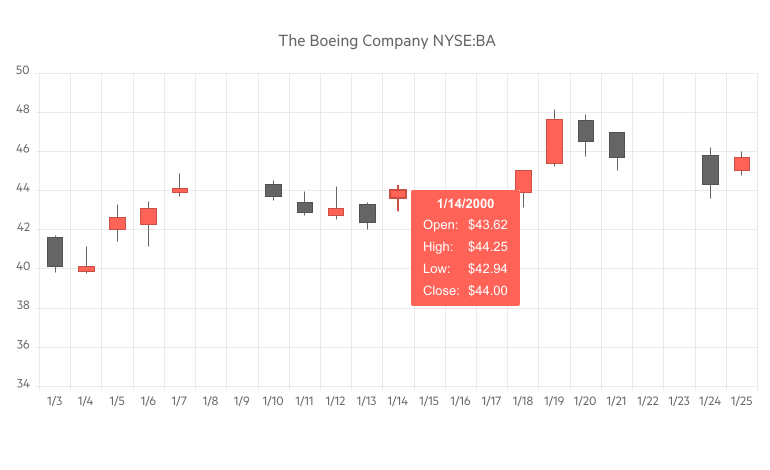
-
Data Binding
The Candlestick chart is a flexible data bound component.
More about chart data binding in Blazor.

-
Right-to-Left (RTL) Support
The Telerik UI for Blazor Candlestick Chart component supports right-to-left configuration. The RTL functionality is supported by most of our components to accommodate users who communicate in a right-to-left language script, such as Arabic and Hebrew.
Learn more in our Blazor Right-to-Left Support documentation