UI for Blazor
Blazor Sankey Chart
- Effortlessly visualize changing flows and their distribution between domains with the Telerik UI for Blazor Sankey diagram.
- Part of the Telerik UI for Blazor library along with 120+ professionally-designed UI components.
- Includes support, documentation, demos, virtual classrooms, Visual Studio Code Extensions and more!
-
Creating and Visualizing Flows Between Data
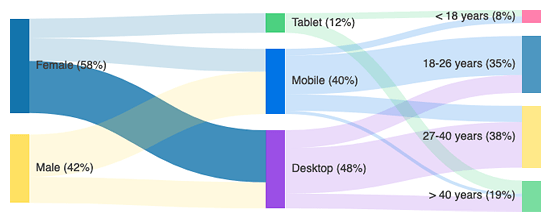
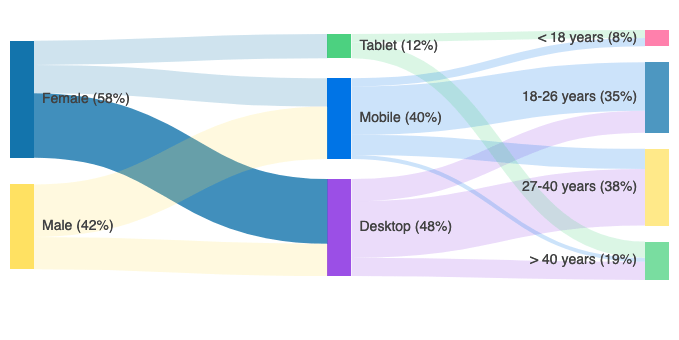
The Telerik UI for Blazor Sankey Chart, a.k.a. a flow diagram, enables you to easily create diagrams that visualize changing flows and their distribution between domains. The Sankey diagrams are ideal for a variety of use cases, including website traffic, budget breakdowns, energy flow, managing order priority flows in retail and more.
-
Customization
Play with the available customization options to modify the Blazor Sankey Chart elements like nodes, links, legend, etc., based on your personal, brand or user preferences.
-
Events
The Telerik UI for Blazor Sankey Diagram generates different events enabling you to tailor the component behavior and quickly react to user interactions:
- onNodeEnter: fires when the user enters a node
- onNodeLeave: fires when the user leaves a node
- onLinkEnter: fires when the user enters a link
- onLinkLeave: fires when the user leaves a link