UI for Blazor
Blazor Linear Gauge
- Use the Blazor Linear Gauge to visualize any data on a linear scale.
- Part of the Telerik UI for Blazor library along with 120+ professionally-designed UI components.
- Includes support, documentation, demos, virtual classrooms, Visual Studio Code Extensions and more!
-
Multiple Pointers
The Gauge supports multiple pointers so that several data pointers can be simultaneously visualized on the same scale. This comes useful in situations like showing the min, max and current value of a variable, for example the temperature for the day.
Check out the Blazor LinearGauge Multiple Pointers in this demo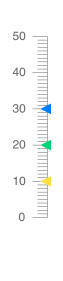
-
Pointer Customization
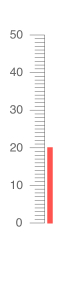
The pointer used in the Gauge can be an arrow next to the proper value or a bar with length equal to the value. The size of both can be modified as well as their color, opacity and margin (distance to the scale).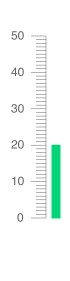
-
Scale Customization
The look of the scale can be similarly customized – its color, width, whether to show major and minor ticks or even reverse the direction of the scale. If one scale isn’t enough, you can even have two or more scale ranges within the same Gauge component. This allows you to create different regions for your variable – going back to the temperature example, imagine placing a blue range below 0° C, a reddish one above 40° C and white neutral one in between.
Learn more about the Blazor LinearGauge Scale Options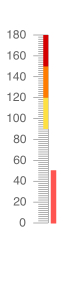
-
Orientation
The Linear Gauge can be placed vertically or horizontally – this affects all elements of the gauge like the scale, labels and pointers which will rotate to their new respective position.
Switch between LinearGauge orientations in this demo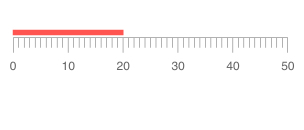
-
Right-to-Left (RTL) Support
The Telerik UI for Blazor Linear Gauge component supports right-to-left configuration. The RTL functionality is supported by most of our components to accommodate users who communicate in a right-to-left language script, such as Arabic and Hebrew.
Learn more in our Blazor Right-to-Left Support documentation

-
Display Data on a Linear Scale with Blazor Linear Gauge
The Telerik UI for Blazor Linear Gauge serves to help you find an easy way to display any data on a linear scale. The component is very useful for illustrating progress towards a goal or a summary of some fluctuating metric.