UI for Blazor
Blazor Stock Chart
- With Blazor Stock Chart you can visualize the price movement of any financial instrument over a certain time.
- Part of the Telerik UI for Blazor library along with 120+ professionally-designed UI components.
- Includes support, documentation, demos, virtual classrooms, Visual Studio Code Extensions and more!

-
Visualize Financial Data with Blazor Stock Chart
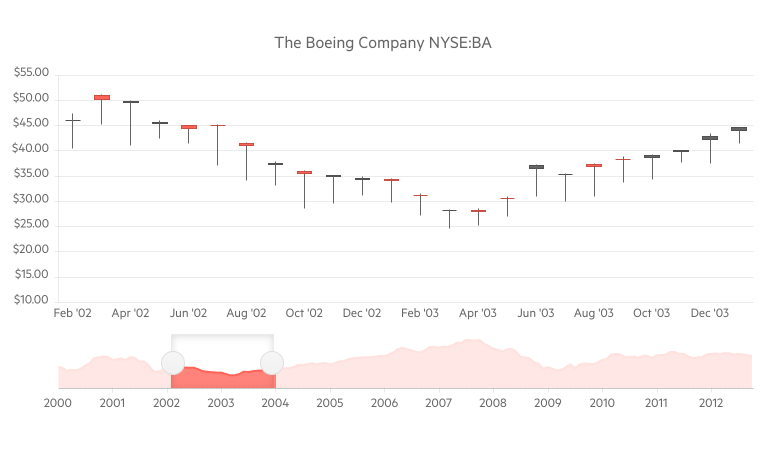
The Telerik UI for Blazor Stock Chart component was added for those of you developing financial applications. The Stock Chart displays changes in the price of a financial unit over time, such as the daily values of a stock price for the past month. You can fully customize the control and change anything from fonts, area background color, opacity, line width and dash types to its dimensions, paddings & margins and tooltips. You can even provide your own templates.
-
Data Binding
Data can be bound to the Stock Chart component in a similar manner to other Charts. Data series should contain extra information, such as the values at the start and the end of the trading day, the respective max/min values and a DateTime field for the x-axis.
Telerik UI for Blazor Stock Chart Data Binding
-
Navigator
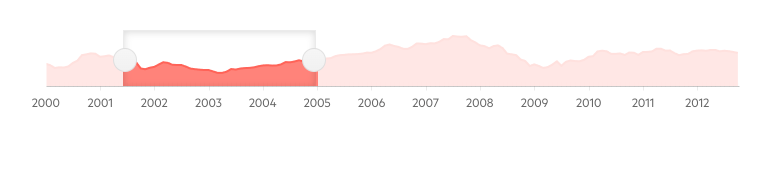
The Navigator is a part of the Stock Chart component and allows users to navigate all the information on the chart by jumping to a date they find interesting and narrowing down to a particular period to see fine-grained details. Based on the specific requirements, you can easily position the Navigator on top or at the bottom of the Stock Chart.
Learn more in the Telerik UI for Blazor Stock Chart Navigator documentation
-
Crosshairs
The Crosshairs are another part of the StockChart. They are a pair of lines, intersecting at the current mouse position, which provide a visual cue for the user to zoom in on a single data point and read its value. When you have to navigate a large amount of data points and/or a large time interval, Crosshairs let you see precise values and not just the trend.
See more about Blazor StockChart Crosshairs in our documentation -
Tooltips
Tooltips are also available when a data point is hovered over. Tooltips can be customized in several ways: you can change only the default colors, provide a template to completely overhaul the design or set different tooltips for different data series.
Tooltip for Telerik Blazor Stock Chart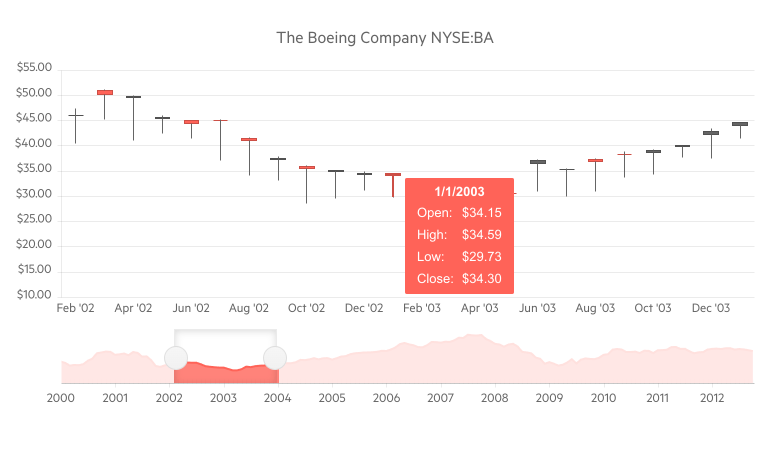
-
Types
The Stock Chart comes in several shapes and sizes: Area, Line, Column, Candlestick and OHLC. They each serve a different purpose and are useful in slightly varying situations. Explore all charts and see them in action in our documentation.
-
Events
The Telerik UI for Blazor Stock Chart will trigger the OnSeriesClick event whenever the user clicks on a data series. Your event handler will receive the relevant information about the click, which varies depending on the type of the Stock Chart. You can then use the click handler to display detailed information about the data point or execute custom logic.

-
Right-to-Left (RTL) Support
The Telerik UI for Blazor Stock Chart component supports right-to-left configuration. The RTL functionality is supported by most of our components to accommodate users who communicate in a right-to-left language script, such as Arabic and Hebrew.
Learn more in our Blazor Right-to-Left Support documentation