UI for Blazor
Blazor Heatmap
- Use the Blazor HeatMap Chart to visualize multiple values as color, packed with built-in tooltip and customization options.
- Part of the Telerik UI for Blazor library along with 120+ professionally-designed UI components.
- Includes support, documentation, demos, virtual classrooms, Visual Studio Code Extensions and more!

-
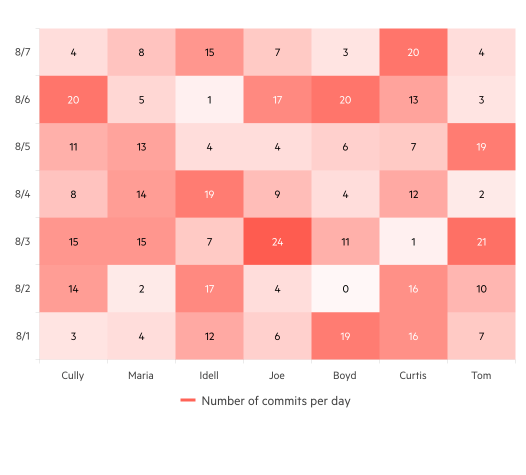
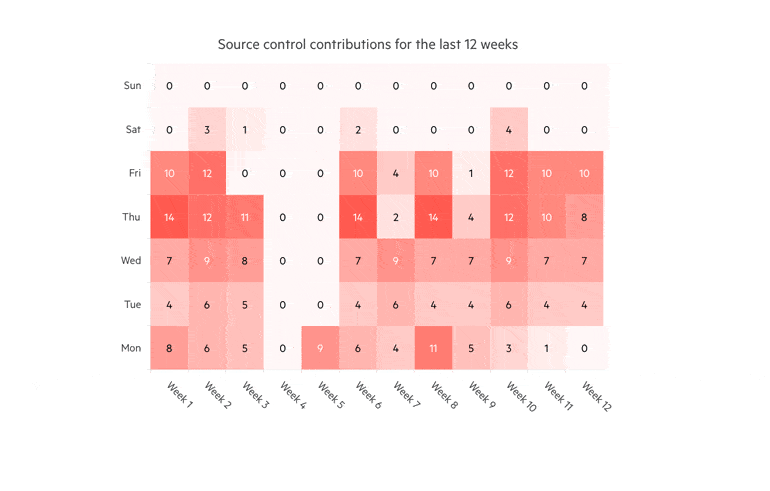
Showcase Magnitude of Multiple Values with Blazor Heatmap
The Telerik UI for Blazor Heatmap Chart is used to display values as color in two dimensions. It allows visualization of multiple values, often recorded on a daily basis, such as temperatures, sales, orders, etc. The component features color scales, category binding, tooltips, shape customization and more.
-
Shapes
The HeatMap Chart allows you to visualize data values in different shapes, such as rectangles and rounded rectangles.
Visit the Blazor HeatMap Shapes demo
-
Color Scales
The HeatMap uses colors to visualize the values across the chart. The colors vary depending on the value, for example, the bigger the value—the denser the color. This makes it easier for users to immediately spot high and low data points on the chart. -
Tooltip
Dealing with a lot of values can be overwhelming. That is why the Blazor HeatMap Chart comes with a built-in tooltip, allowing you to focus on only one value at a time upon hovering over it. The tooltip displays additional information, and its color corresponds to the value color on the chart.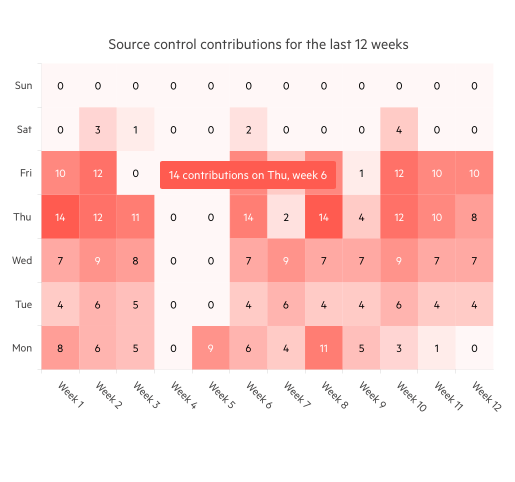
-
Theming
Style the HeatMap chart using the four built-in themes and variety of swatches including Default (Main Dark, Nordic, Purple), Material (Arctic, Lime Dark, Nova), Bootstrap (Urban, Vintage etc.) and Fluent. You can easily customize the available themes with a few lines of CSS or create a new one with the Progress SASS ThemeBuilder application.
-
Right-to-Left (RTL) Support
The Telerik UI for Blazor Heatmap component supports right-to-left configuration. The RTL functionality is supported by most of our components to accommodate users who communicate in a right-to-left language script, such as Arabic and Hebrew.
Learn more in our Blazor Right-to-Left Support documentation