
UI for Blazor
Blazor Trendline Chart
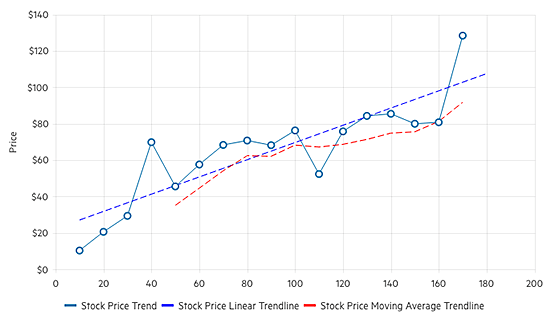
- Display data points in a time series or sequential order with Telerik UI for Blazor Trendline Chart.
- Part of the Telerik UI for Blazor library along with 120+ professionally-designed UI components.
- Includes support, documentation, demos, virtual classrooms, Visual Studio Code Extensions and more!
-
Visualize and Analyze Trends with Ease
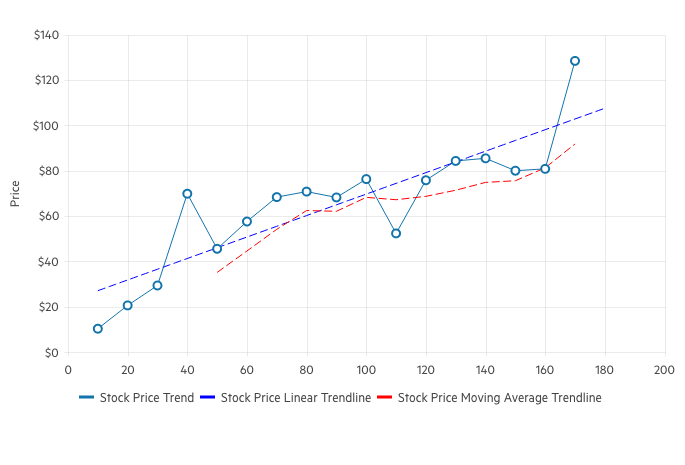
Telerik UI for Blazor Trendline Chart enables you to represent and analyze trends, patterns and relationships in the data over time. It showcases data points in a time series or sequential order. Trendline charts are leveraged in fields like finance, economics, statistics and data analysis to identify and better understand trends. They tend to facilitate the process of making informed decisions.
-
Trendline Chart Data Binding
Blazor Trendline Chart is a data bound component which also provides the flexibility to bind axes and series to various data sources separately or together.

-
Trendline Types
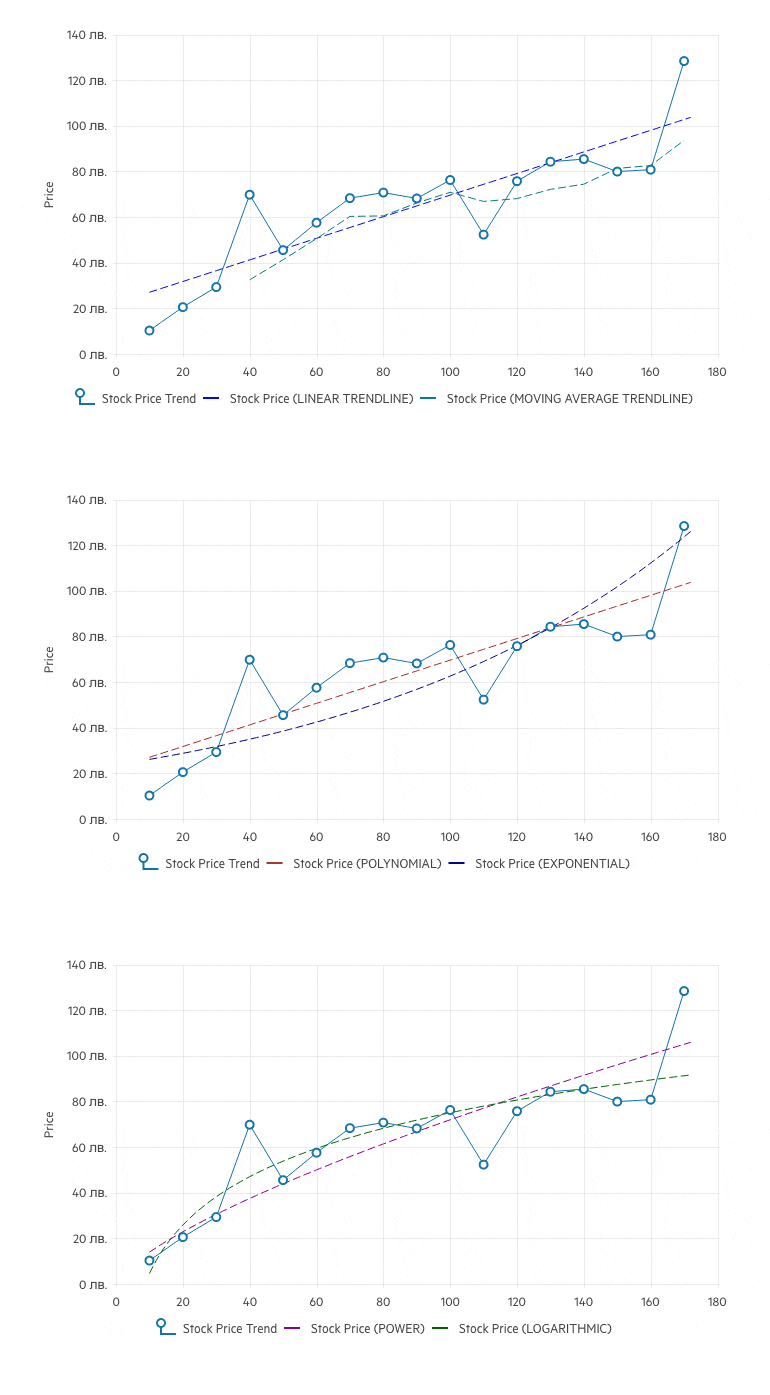
Multiple types of trendlines are supported by the Telerik UI for Blazor Trendline Chart to cover any use case.
- Linear Trendline: It is used to indicate whether a specific quantity is on the rise or decline over time.
- Moving Average Trendline: It smooths out data fluctuations by computing an average of all data points over a specified period.
- Exponential Trendline: it is used to visualize data with rapidly accelerating growth or decay over time.
- Logarithmic Trendline: It is leveraged to display data with rapid initial growth that slows over time or vice versa.
- Power Trendline: It is used to highlight trends where the rate of change isn't constant.
- Polynomial Trendline: It covers complex data patterns not fitting the other trendline types. It allows more flexible representation of trends with multiple turning points.
See the Telerik UI for Blazor Trendline Chart types documentation
-
Globalization
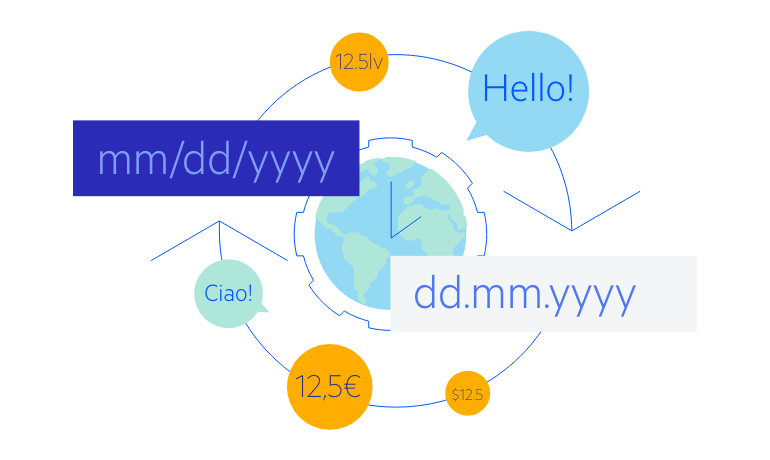
The Label Format Strings in Blazor Trendline Chart are culture aware, so your users see, for example, the expected number formats with the decimal and thousands of separators they are used to.
-
Right-to-Left (RTL) Support
The Telerik UI for Blazor Trendline Chart supports right-to-left configuration. The RTL functionality is supported by most of our components to accommodate users who communicate in a right-to-left language script, such as Arabic and Hebrew.
Learn more in our Blazor Right-to-Left Support documentation

-
Integration with Other Chart Types
To unleash the full potential of Telerik UI for Blazor Charts, trendlines are supported for the following chart types:
See the Telerik UI for Blazor Trendline Chart integrations documentation
All Blazor Components
Data Management
Scheduling
File Upload & Management
Editors
- AutoComplete
- CheckBox
- ColorGradient
- ColorPalette
- ColorPicker
- ComboBox
- DateInput
- DatePicker
- DateRange Picker
- DateTimePicker
- DropDownList
- DropDownTree New
- FlatColorPicker
- ListBox
- MaskedTextBox
- MultiColumn ComboBox
- MultiSelect
- Numeric TextBox
- PromptBox New
- RadioGroup
- Rating
- Rich Text Editor
- Signature
- TextArea
- TextBox
- TimePicker
Data Visualization
- Area Chart
- Bar Chart
- Barcode
- Bubble Chart
- Candlestick Chart
- Chart
- Column Chart
- Donut Chart
- Heatmap
- Line Chart
- OHLC Chart
- Pie Chart
- QR Code
- Radar Area Chart
- Radar Column Chart
- Radar Line Chart
- Range Area Chart
- Range Bar Chart
- Range Column Chart
- Sankey Chart
- Scatter Chart
- Scatter Line Chart
- Stock Chart
- Trendline Chart
- Waterfall Chart
Interactivity & UX
- AI Prompt
- Chat Updated
- ChunkProgressBar
- Dialog
- Inline AI Prompt
- Loader
- Loader Container
- Notification
- Popover
- Popup
- ProgressBar
- RangeSlider
- Skeleton
- Slider
- ValidationMessage
- ValidationSummary
- ValidationTooltip
Navigation
Layout
- Animation Container
- Avatar
- Card
- Carousel
- DockManager
- Form
- GridLayout
- MediaQuery
- PanelBar
- Splitter
- StackLayout
- TileLayout
- Tooltip
- Window
- Wizard
Geo Visualization
Document Processing
Productivity Tools
Gauges
Labels
Icons
