UI for Blazor
Blazor OHLC Chart
- Use the Blazor OHLC Chart to illustrate movements in the price of a financial instrument over time.
- Part of the Telerik UI for Blazor library along with 120+ professionally-designed UI components.
- Includes support, documentation, demos, virtual classrooms, Visual Studio Code Extensions and more!

-
Visualize Data with OHLC Chart
The OHLC Chart series are typically used to illustrate price movements and show the four major data points (open-high-low-close) over a period of time.
Learn more about the Blazor OHLC chart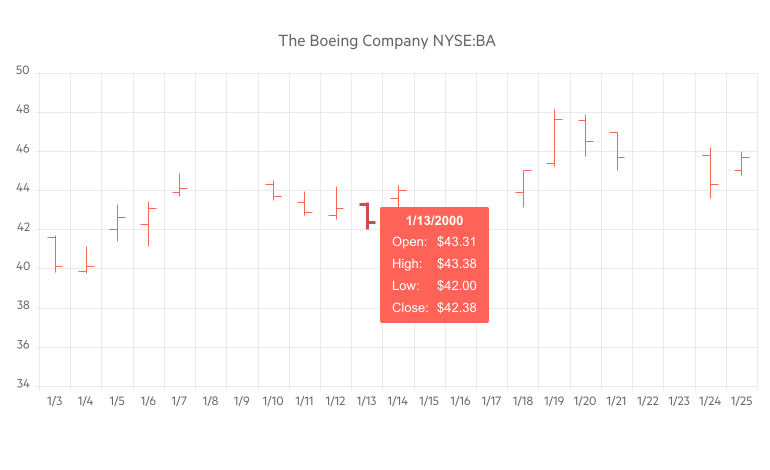
-
Data Binding
The OHLC chart is a flexible data bound component.
More about chart data binding in Blazor.

-
Right-to-Left (RTL) Support
The Telerik UI for Blazor OHLC Chart component supports right-to-left configuration. The RTL functionality is supported by most of our components to accommodate users who communicate in a right-to-left language script, such as Arabic and Hebrew.
Learn more in our Blazor Right-to-Left Support documentation