
Kendo UI for Angular
Angular Gantt Chart
- Visualize projects and processes with the customizable Angular Gantt Chart component.
- Part of the Kendo UI for Angular library along with 110+ professionally-designed components.
- Includes support, documentation, demos, virtual classrooms, Visual Studio Code Extensions and more!
-
Interactive Gantt Views for Your Angular Scheduling Apps
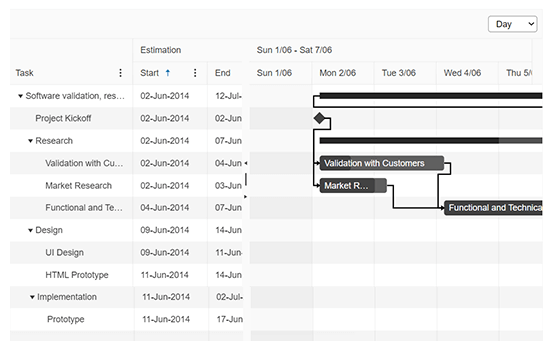
Create project plans and other schedules in no time with the Angular Gantt Chart component. This interactive, data bound, and customizable component provides a task TreeList and a timeline pane. In the task list, users can edit, sort, and reorder records. In the timeline, users can resize, move, edit, and remove tasks. The timeline can also be displayed in day, week, and month views.
-
Data Binding
Bind the Angular Gantt component local or remote data and automatically populate tasks, dependencies, dates, and more. The data can, but doesn’t need to, be hierarchical. Flat data will work perfectly.
-
Task TreeList Column Options
Tasks and their related information are displayed in a TreeList pane. The Angular Gantt Chart gives you a virtual toolbox to make it exactly what you need. Options include the following:
- Auto-generate columns based on your data or configure your own.
- Hide columns programmatically or give the user the ability to do the same.
- Span content over multiple columns.
- Use templates to customize headers, cells, or contents.
- Set multi-column headers.
- Allow column resizing.
- Allow column reordering.
- Add a column menu with actions such as sort, filter, and visibility.
-
Tasks
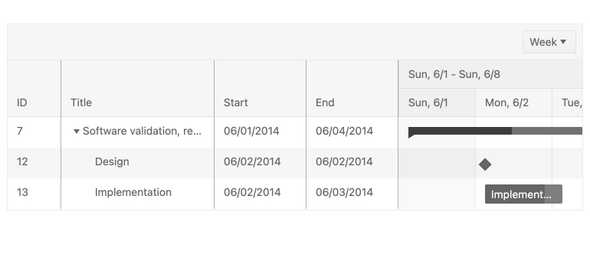
The Angular Gantt Chart includes a list of tags to designate task types. These include a “summary” task, a task which has child tasks, a “regular” task, a task without child items, or a “milestone” task, which is a task without child items that has the same start and end date.
-
Dependencies
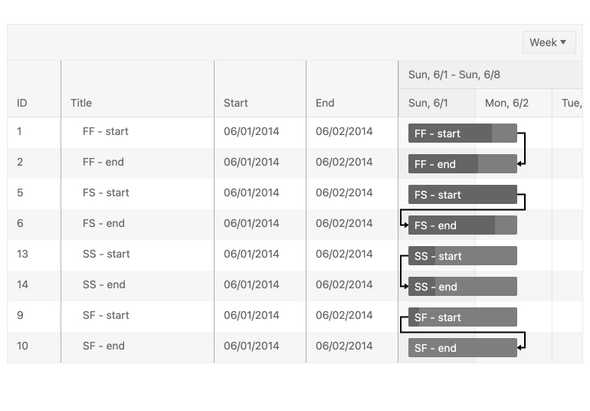
To easily manage the relationships between different tasks, the Angular Gantt component provides four different dependency types: the “finish to finish” type, the “finish to start” type, the “start to start” type, and the “start to finish” type. Using these dependency types, you can ensure that tasks are properly defined.
-
Sorting
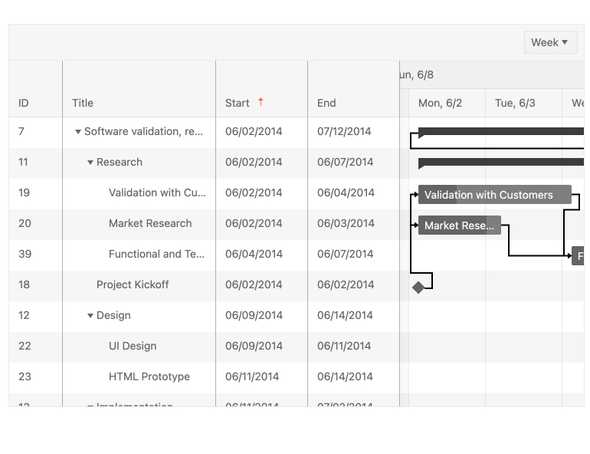
With sorting enabled, the Angular Gantt Chart can reorganize all available tasks to be sorted by a specific data field, such as task start date or task type. Sorting can be enabled via a single configuration option and users can sort by clicking the header of a field. Clicking multiple times allows users to sort the items in an ascending order, descending order, or no sort order at all, giving them the option to remove any applied sorting. You can also programmatically set sorting and sort order, which means columns can be sorted upon initial render.
-
Filtering
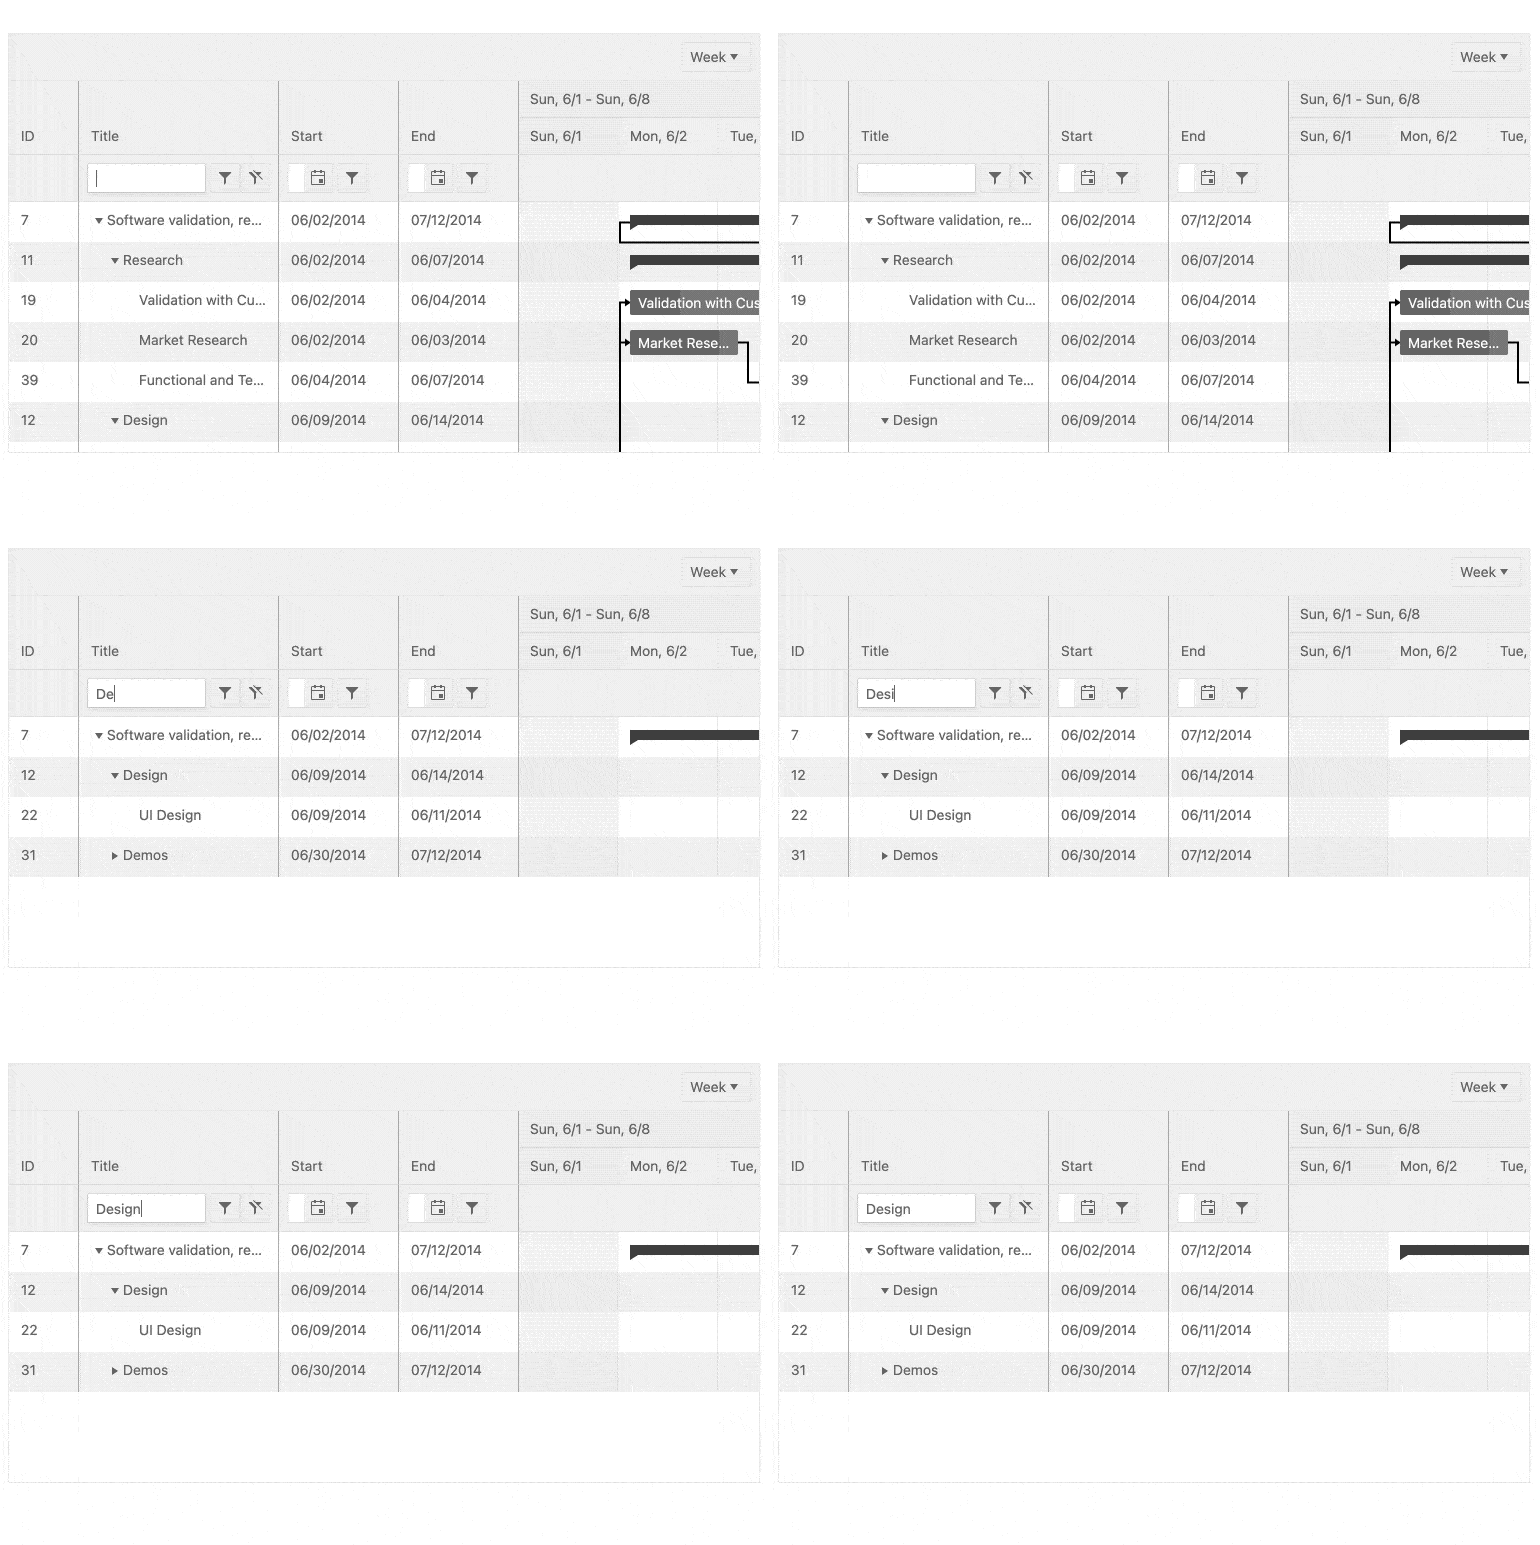
The Angular Gantt component helps users reduce the number of items in their UI through filtering. Filtering can be done via a dedicated filter menu or by using fields such as text and dates as filters. Additionally, you can configure conditional filters, such as “starts with”, “contains” and more, on a column-by-column basis to give users maximum flexibility to manage their planning.
-
Day, Week, Month, and Year Views
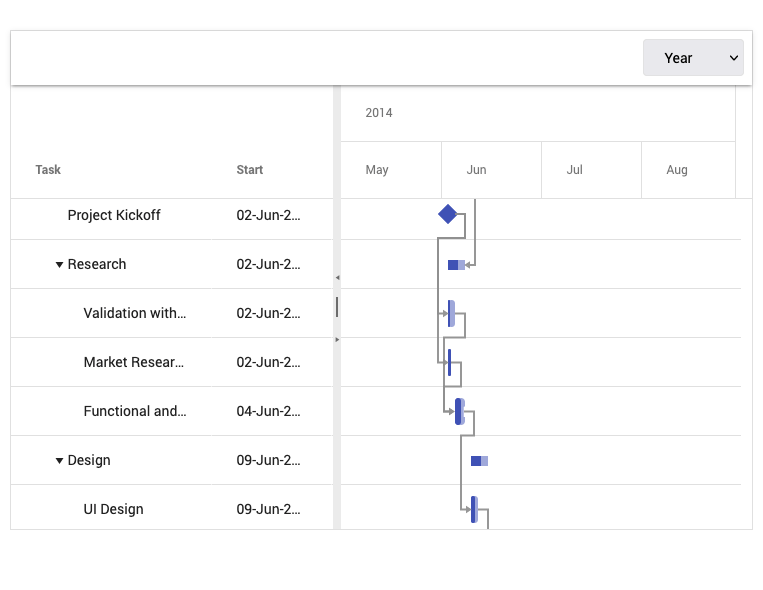
The Angular Gantt chart can display the task timeline by day, week, month, or year. Each view is further broken down by its child view. Days are broken into hours, weeks into days, months into weeks, and years into months. You can set this view programmatically or allow the user to decide.
-
Edit Directly In-cell or Via Dialog
Choose to allow users to edit tasks listed in the TreeList in two ways. They can edit directly in cells or you can choose to implement the built-in dialog for a more full-featured experience.
See the Angular Gantt Editing demo -
Selection
Allow users to interact with and select single or multiple items in the task pane or items on the timeline.
See the Angular Gantt Selection Demo -
Accessibility
Accessibility is important but can be tedious. We have got it covered. Our Angular Gantt chart is AAA rated with WCAG 2.0 and is compliant with Section 508 and WAI-ARIA standards.

-
Also Available...
The Gantt Chart component is also available for these popular Web frameworks:
Frequently Asked Questions
-
Why should you choose the Kendo UI for Angular Gantt Chart?
- All Kendo UI for Angular components are built from the ground up for Angular. Many others are wrappers around jQuery or other technologies.
- The component is highly customizable and can be easily modified to suit your needs.
- It is one of over 100 other components in our Angular components library that developers use to build modern, consistent UI.
- As a commercial product, it is frequently updated for Angular compatibility and user demand by a full-time team of experts.
- Our support team consistently wins accolades from industry organizations and users themselves.
- Each feature is meticulously documented.
-
Where can I buy the Kendo UI for Angular Gantt Chart?
The Angular Gantt Chart component is one of over 100 in the Kendo UI for Angular components library which is part of the Kendo UI bundle. Kendo UI includes libraries for jQuery, Angular, React, and Vue. You can purchase Kendo UI online or by contacting sales.
You can also choose to purchase DevCraft, which bundles all our .NET and JavaScript components.
-
How do I get started with the Kendo UI for Angular Gantt Chart?
Getting started is easy. Visit the Angular Gantt Chart Getting Started tutorial for an easy step-by-step tutorial. All you need to do is install the NPM package, add the component to a page, and set desired properties!
Don’t forget to sign up for a trial of the Kendo UI for Angular components library. This gives you a 30-day license and access to support resources to help you during your learning and evaluation process.
-
What is the Kendo UI for Angular Gantt Chart used for?
Most organizations use the Angular Gantt Chart to add project tracking to an application. If your data model has resources, tasks, start dates, and end dates, it is easy to visualize the project timeline.
-
How can I try the Kendo UI for Angular Gantt Chart?
You can try all Kendo UI for Angular Components by signing up for a 30-day trial. During your evaluation, you will have access to all the components, technical support, documentation and on-demand technical training.
See the Angular Gantt Chart Getting Started article for a quick tutorial. Also, don’t forget to sign up for a trial of the Kendo UI for Angular components library to get free support.
-
What other scheduling or project management components are available in the Kendo UI for Angular components library?
The Angular Scheduler is another popular scheduling tool. Also called an event calendar, it works much like Microsoft Outlook and allows you to add appointment scheduling to your applications. Developers use it to create appointment calendars, task trackers, and room schedulers.
All Kendo UI for Angular Components
Charts
- Area Chart
- Bar Chart
- Box Plot
- Bubble Chart
- Bullet Chart
- Charts Updated
- Donut Chart
- Funnel Chart
- Heatmap
- Line Chart
- Pie Chart
- Polar Chart
- Pyramid Chart
- Radar Chart
- Range Area Chart
- Scatter Chart
- Sparkline
- Waterfall Chart
Editor
TreeList
Scheduler
Progress Bars
Buttons
Common Features
Conversational UI
Indicators
Diagrams and Maps
Date Inputs
Dialogs
Labels
Icons
Design
Navigation
Dropdowns
- AutoComplete Updated
- ComboBox Updated
- DropDownList
- DropDownTree
- MultiColumnComboBox Updated
- MultiSelect Updated
- MultiSelectTree
Gauges
Grids
Upload
Inputs
- Checkbox
- ColorGradient
- ColorPalette
- ColorPicker
- FlatColorPicker
- FormField
- MaskedTextBox Updated
- NumericTextBox Updated
- RadioButton
- RangeSlider
- Signature
- Slider
- Switch
- TextArea
- TextBox
- TreeView
Bar & QR Codes
Data Tools

Get Started with Kendo UI for Angular
