Kendo UI for Angular
Angular Funnel Chart
- Illustrate a decreasing or increasing tendency in your data with the Kendo UI for Angular Funnel Chart.
- Part of the Kendo UI for Angular library along with 110+ professionally-designed components.
- Includes support, documentation, demos, virtual classrooms, Visual Studio Code Extensions and more!
-
Build Powerful Data Visualizations with the Angular Funnel Chart
The Kendo UI for Angular Funnel Chart shows how data flows through the different stages of a process. It displays an increasing or decreasing progression of a single data series, forming a funnel organized in segments. Each segment of the funnel is encoded by a unique value in your dataset and a stage of the process, represented by a different color. The Angular Funnel chart is perfect for tracking business metrics like the opportunities in a sales funnel or leads along the customer journey.
-
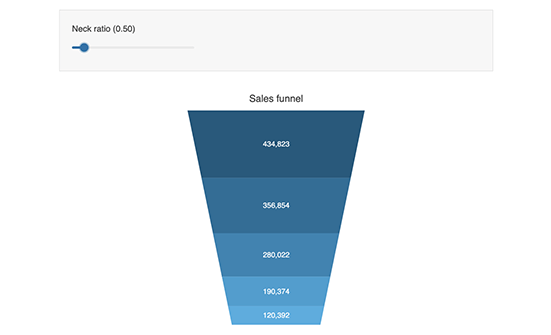
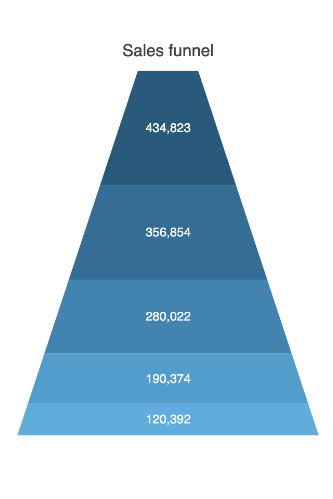
Funnel Shape
Customize the shape of the Angular Funnel Chart by defining the neck-to-top ratio. By default, the value of the neck ratio is set at 0.3, meaning that the width of the base is 30% of the width of the top. You can use the chart’s ratio equalizer to adjust the ratio and create the funnel shape that best first your application, including flipping the funnel upside down into a pyramid.
-
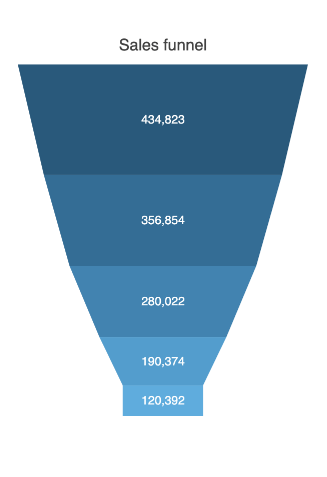
Dynamic Slope and Height
You can choose to have a freeform representation of the funnel shape by enabling the dynamic slope and height of the Angular Funnel Chart. That will render each segment of the funnel is a size relative to the value it represents.
-
Data Binding
You can populate the Angular Funnel Chart series with data from various source types, including numbers, arrays and objects (or models)—simply specify the fields you want to use during configuration.
-
Rendering
The Angular Funnel Chart renders data in the Canvas (bitmap) and SVG (vector graphics) formats. SVG is the default format to ensure an always crips presentation of your data. When performance is the priority, you can easily switch to a canvas format through a single configuration option to ensure your chart will handle large data and real-time updates with no interruption.
-
Export Options
You can export your Angular Funnel Chart to PDF, SVG, PNG and the Kendo UI drawing format. In scenarios where you need to change the image size or fit the chart to a paper size when exporting to PDF, the intuitive export method of the component will allow you to preserve the quality and rendering of the chart in the output file.
-
Themes
Customize the series colors of the Kendo UI for Angular Funnel Chart component with one of our predefined color sets, including Default (our own styling), Material (based on the Material Design guidelines), Bootstrap (resembles the Bootstrap styling) and Fluent (based on Microsoft Fluent UI). You can further customize any of the built-in themes or create a new theme to match your branding using Progress ThemeBuilder.
-
Globalization
The Kendo UI for Angular Funnel Chart supports globalization and localization to ensure that the component can effectively support any application’s language and locale. You can also enable the right-to-left (RTL) rendering for languages that use right-to-left scripts.


Get Started with Kendo UI for Angular