Kendo UI for Angular
Angular Radar Chart
- Compare two or more data series with the Kendo UI for Angular Radar Chart.
- Part of the Kendo UI for Angular library along with 110+ professionally-designed components.
- Includes support, documentation, demos, virtual classrooms, Visual Studio Code Extensions and more!
-
Build Powerful Radar Charts with Kendo UI for Angular
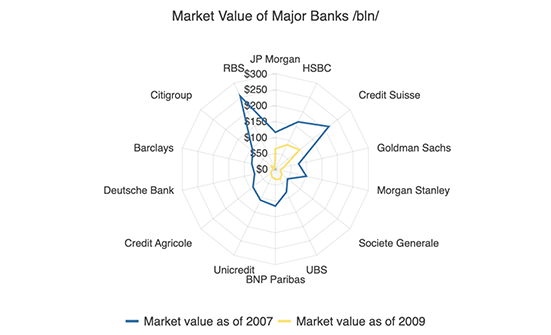
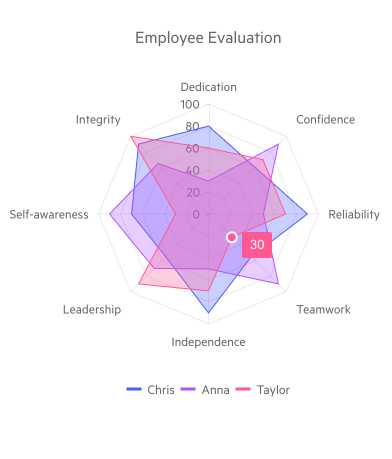
The Kendo UI for Angular Radar Chart displays data points from multiple variables over a radial graph. It helps you compare diverse categories by plotting their values along a radial coordinate system and without creating any visual clutter. A popular use case for the Angular Polar Chart is visualizing the Myers-Briggs personality assessment test. Enjoy built-in customization options for multiple axes, flexible data binding and modern themes.
-
Flexible Data Binding
You can flexibly bind the Kendo UI for Angular Radar chart to various data sources, including simple arrays with X and Y values and advanced data types and objects with fields. The component also provides the flexibility to bind axes and series to your custom data sources.
-
Customizing Radar Chart Elements
You can customize all aspects of the Angular Radar Chart—from the X axes to their series, labels, line and marker color.
-
Rendering
The Angular Radar Chart renders data in the Canvas (bitmap) and SVG (vector graphics) formats. SVG is the default format to ensure an always crips presentation of your data. When performance is the priority, you can easily switch to a canvas format through a single configuration option to ensure your chart will handle large data and real-time updates with no interruption.
-
Export Options
You can export your Angular Radar Chart to PDF, SVG, PNG and the Kendo UI drawing format. In scenarios where you need to change the image size or fit the chart to a paper size when exporting to PDF, the intuitive export method of the component will allow you to preserve the quality and rendering of the Chart in the output file.
-
Angular Radar Chart Themes
Customize the series colors of the Kendo UI for Angular Radar Chart component with one of our predefined color sets, including Default (our own styling), Material (based on the Material Design guidelines), Bootstrap (resembles the Bootstrap styling) and Fluent (based on Microsoft Fluent UI). You can further customize any of the built-in themes or create a new theme to match your branding using Progress ThemeBuilder.
-
Globalization
The Kendo UI for Angular Radar Chart supports globalization and localization to ensure that the component can effectively support any application’s language and locale. You can also enable the right-to-left (RTL) rendering for languages that use right-to-left scripts, such as Arabic and Hebrew.


Get Started with Kendo UI for Angular