Kendo UI for Angular
Angular Diagram
- Build flowcharts, org charts and network diagrams in minutes. Bind shapes and connections to live data for dynamic visuals. Apply automatic layouts, in-place editing and export to PDF, SVG or PNG
- Part of the Kendo UI for Angular library along with 110+ professionally-designed components.
- Includes support, documentation, demos, virtual classrooms, Visual Studio Code Extensions and more!
-
Horizontal and virtual scroller for large diagrams
Handle large, information dense diagrams without overwhelming the browser using the horizontal and virtual scroller. Users can move across wide flows with horizontal and vertical scrolling and panning, while the Diagram renders only what is needed in the viewport so performance stays smooth even with many nodes and connections. This combination makes it practical to visualize full end to end processes or big dependency graphs in a single interactive canvas instead of splitting them into separate pages.

-
Horizontal and vertical diagram layouts
Give your users diagrams that match how they read processes by controlling layout orientation. Updated tree and layered layout algorithms let you arrange nodes in clear horizontal or vertical layers and choose from subtypes such as down, up, left, right and mind map variants for different use cases. You get automatic positioning and routing, but still keep control over spacing, layer distance and grid settings so complex flows remain legible as they grow.

-
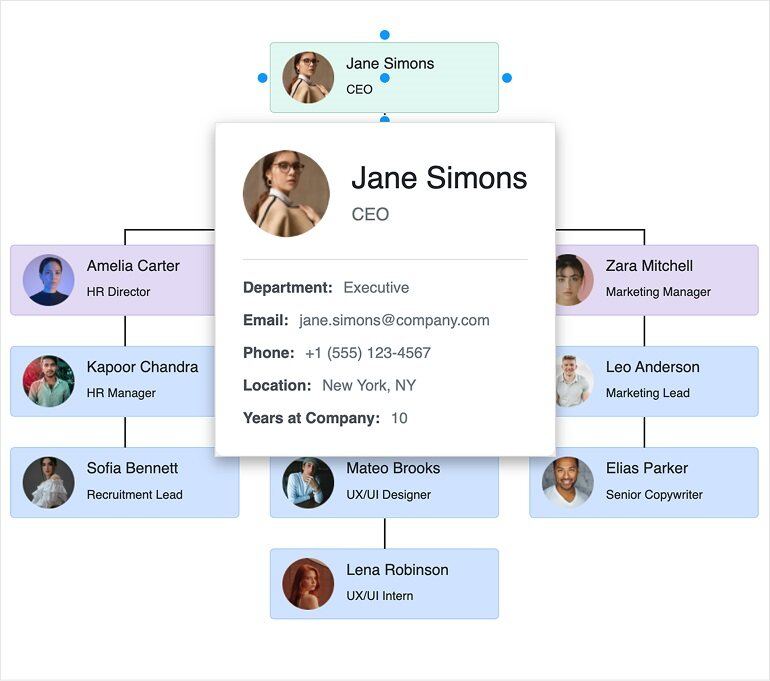
Nodes and tooltips for richer diagrams
Display contextual information directly on top of your data bound nodes and connections with first class tooltip support in the Angular Diagram. Configure
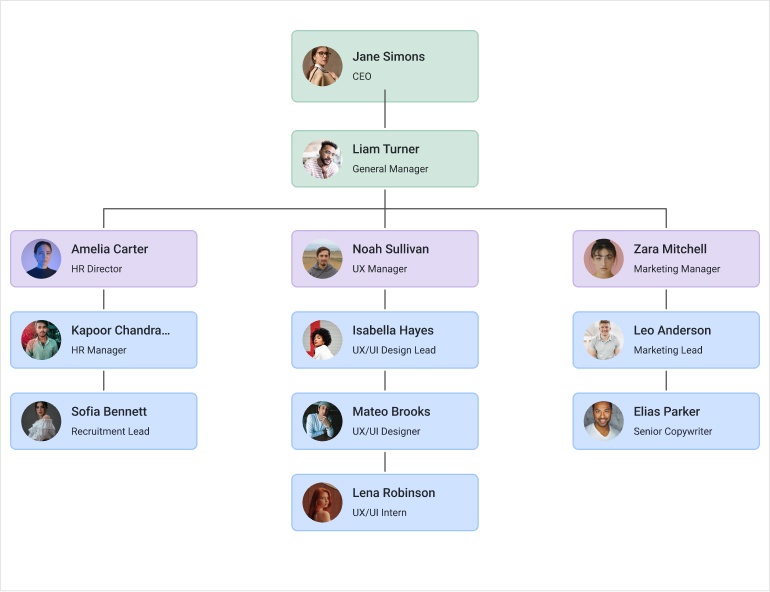
tooltipTexton shapes and connections, turn tooltips on globally or per element and style them with CSS or Angular templates so every node can surface exactly the right copy. This makes it easy to build org charts, dependency graphs or customer journeys where users can hover any element to understand roles, metrics or relationships without cluttering the diagram.
-
Model processes visually in Angular
The Kendo UI for Angular Diagram component helps teams plan, explain and automate complex processes using interactive diagrams. Create and edit shapes, route connections, apply automatic layouts and bind everything to your data to keep visuals accurate and in sync with your app. Built natively for Angular, the Diagram integrates seamlessly with other Kendo UI for Angular components and supports high-performance rendering.
-
Data binding
Generate diagrams from your data models and keep them in sync with updates. Bind shapes and connections to hierarchical or flat data to render org charts, decision trees or network maps with minimal code.
See the Angular Diagram data binding demo.
-
Shapes and customization
Use ready-made rectangles, circles, images and text shapes or define custom SVG visuals. Control size, styling, content and even provide a visual function for fully custom rendering of each node.
See the Angular Diagram shapes demo.
-
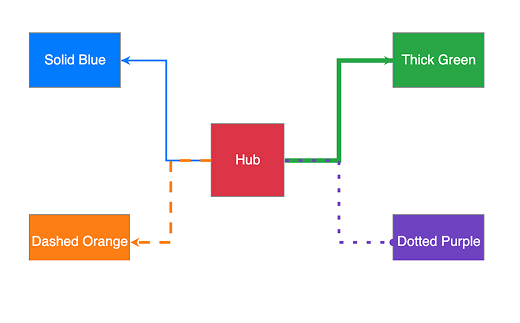
Connections and routing
Represent relationships with polyline or cascading connections and fine-tune caps, labels and stroke styling. Connect via named connectors on each shape and control selection and editing behavior.
See the Angular Diagram connections demo.
-
Automatic layouts
Apply tree, layered, force-directed or radial layouts to arrange shapes and route lines for a clean result. Configure spacing, grids and separation to match the structure of your data.
See the Angular Diagram layouts demo.
-
Editing and manipulation
Enable intuitive drag, resize and connect operations with shape-level or global permissions. Let users add, move or remove elements while you stay in control of what is editable.
See the Angular Diagram editing demo.
-
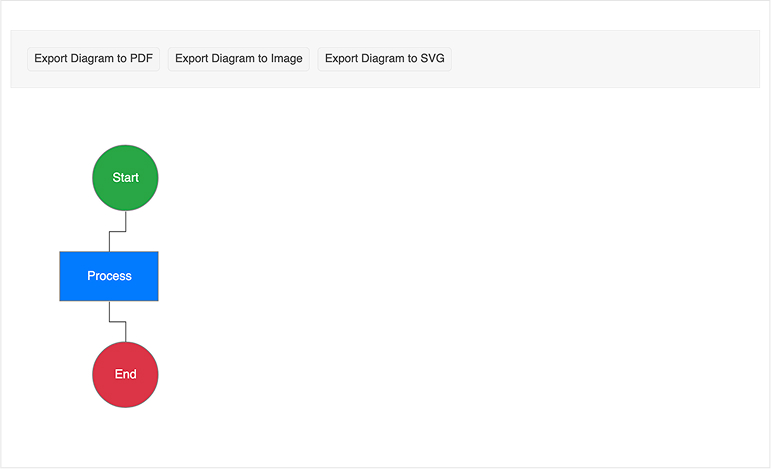
Export to PDF, SVG or PNG
Export any diagram to PDF, image or SVG using the Kendo Drawing API with options for paper size, orientation and quality. Preserve scale correctly with built-in export helpers.
See the Angular Diagram export demo.
-
Events and interactivity
Respond to user intent with a rich event set for drag, select, zoom, pan and content changes. Build tailored behaviors and analytics by subscribing to the events you need.
See the Angular Diagram events demo.
-
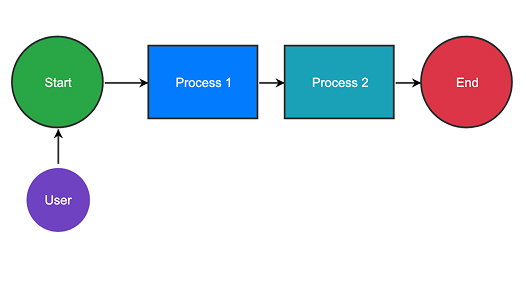
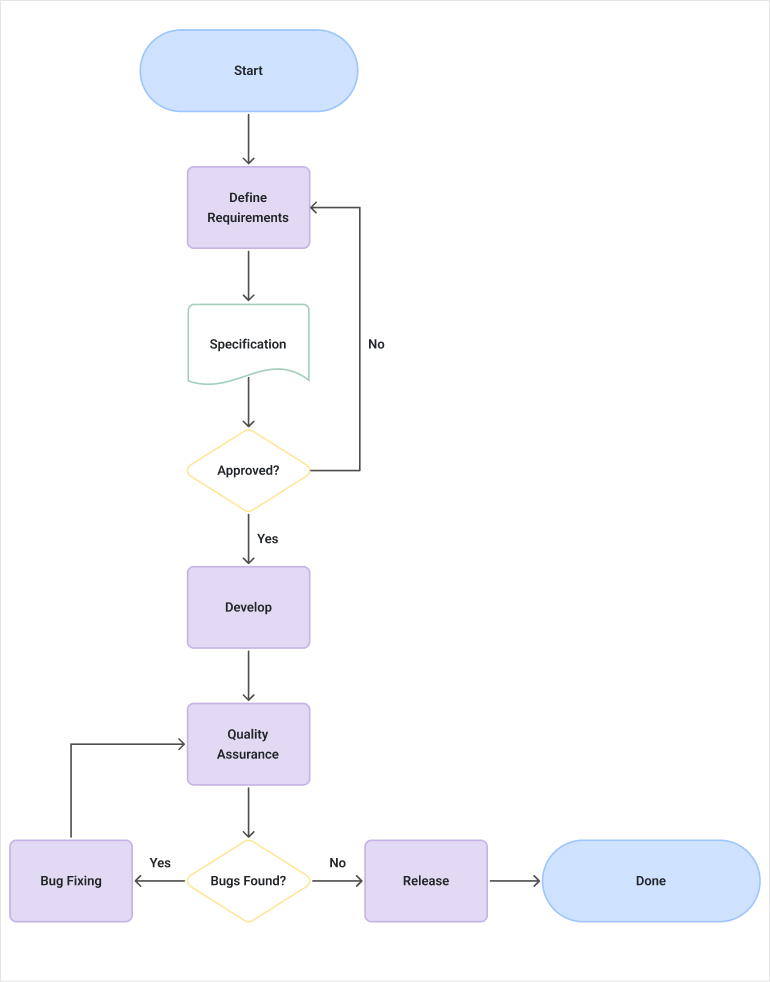
Workflow diagram
Illustrate multi-step processes with decision points, loops and handoffs using the built-in workflow diagram sample. Start from the example then adapt shapes, connections and layout to your scenario.
-
Tooltips for Diagram
The Diagram Tooltips feature lets you display contextual information when users hover shapes and connections, so they can understand each element at a glance without crowding the diagram surface. You define tooltip text per item through the
tooltipTextproperty, then control when tooltips appear withtooltip.visible, enabling them globally throughshapeDefaultsandconnectionDefaultsor overriding behavior per shape or connection for fine-grained UX control.Beyond basic text, Diagram tooltips are easy to style and extend. You can apply custom CSS via the
cssClassoption and plug in Angular templates withkendoDiagramShapeTooltipTemplateandkendoDiagramConnectionTooltipTemplate, which expose each element'sdataItemso you can show rich details like roles, metrics or relationships right on hover while keeping complex org charts, process flows and dependency graphs clean and readable.See the Angular Diagram Tooltips demo
-
Rich Text Content
Enhance your Kendo UI for Angular Diagram with rich text content support thanks to which diagram elements are no longer limited to plain text. You can format content, emphasize key details, and structure information more clearly, making diagrams easier to read and more effective for communication.

Get Started with Kendo UI for Angular