
UI for ASP.NET Core
ASP.NET Core Charts
- Present any data in an easily understandable and visually appealing way with the ASP.NET Core Charts.
- Part of the Telerik UI for ASP.NET Core library along with 120+ professionally designed UI components.
- Includes support, documentation, demos, virtual classrooms, Visual Studio Code Extensions and more!
-
Various ASP.NET Core Chart Types
The ASP.NET Core Chart component offers several different chart types that can each be fully customized and stylized to fit your application:
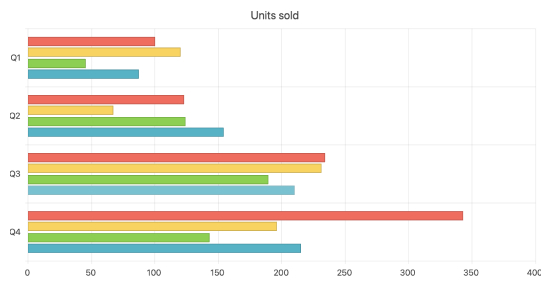
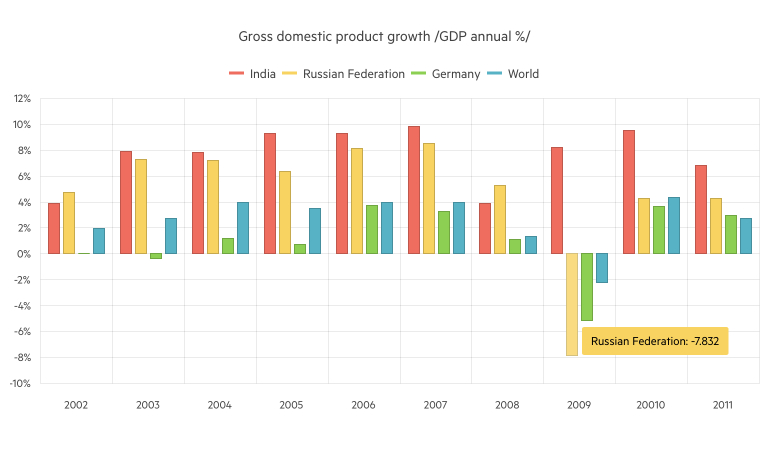
- Bar or Radar to compare several data sets
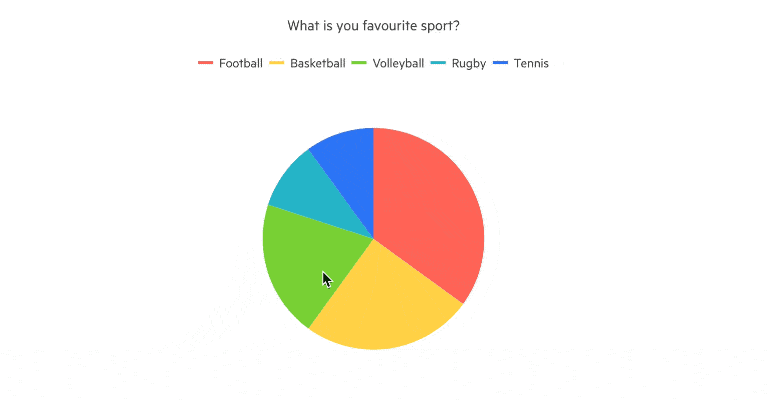
- Pie or Donut chart to visualize a piece of data as part of a whole
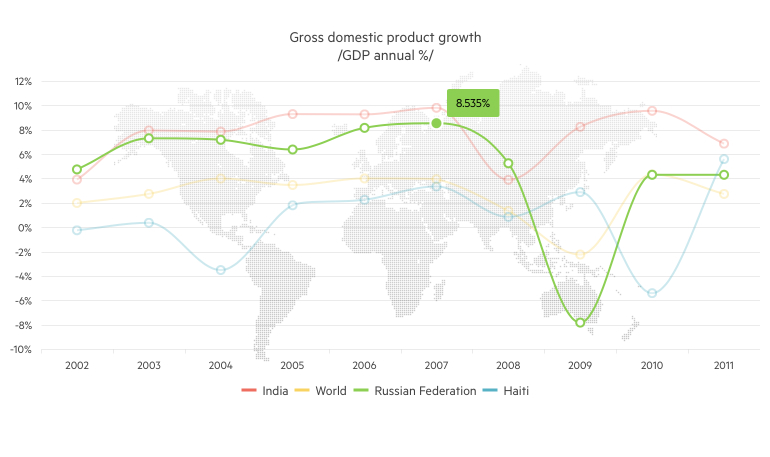
- Line or Area to monitor trends
- Bullet chart to compare quantitative against qualitative measures
- Scatter or Bubble to visualize the correlation in a set of engineering data
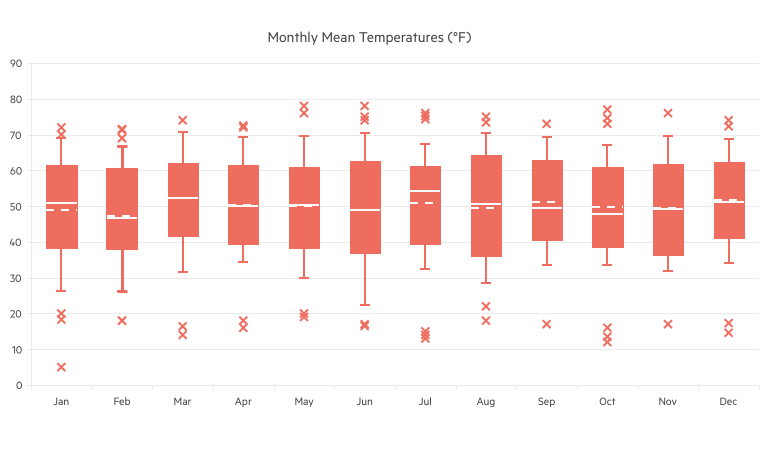
- Box Plot to graphically depict your statistical data
- Waterfall to represent cumulative effect of consecutive positive or negative values
- RangeBar to visualize value ranges over time
- Funnel to represent the stages in a process
- Polar to plot engineering data in a polar coordinate system
- Sparklines to provide context to your data
- Pyramid displays data within a pyramidical structure
- Trendline to represent data points in a time series or sequential order
- Sankey Diagram to visualize changing flows and their distribution between domains
-
Support a Number of Data Types
The Telerik ASP.NET Core Charts support various data types. Depending on the chart type, you can distribute numerical data over categories (strings), units of time (DateTime) or other numbers.
-
ASP.NET Core Chart High Performance
The Core Charting component is rendered completely through JavaScript, making it server-platform agnostic and boosting the performance of your application.
By default, the ASP.NET Core Chart control is powered by Scalable Vector Graphics (SVG), enabling animations and interactivity in modern browsers with a fallback to Vector Markup Language (VML) for older browsers. Canvas rendering is also supported when a higher fps rate is required for frequent/live data updates.

-
DrillDown Charts
Elevate users’ charting experience by providing access to more granular data – e.g., breakdown by product of the selected category. Leverage the DrillDown feature in Telerik UI for ASP.NET Core Charts to enable users to click on a point (bar, pie segment, etc.) in order to navigate to a different, more informative view.
See the Telerik UI for ASP.NET Core Charts DrillDown demo
-
Export to PDF
Export the content of the charts to PDF and easily customize the look and feel of the exported file to match user requirements.
-
Simple-to-Customize Look and Feel
You can easily change the alignment and appearance of your ASP.NET Core Chart using the built-in customization options for its axes, labels, tooltips, title, subtitle, legend and more elements. Or you can take advantage of the automatic layout adjustment and have your ASP.NET Core Chart automatically position its elements.
-
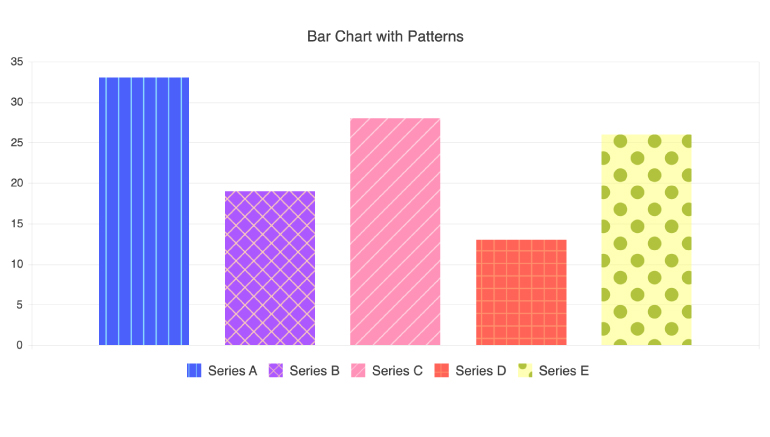
Chart Patterns
The robust customization options of the Telerik UI for ASP.NET Core Charts also include support for using patterns in chart series. The series patterns can be used to visually differentiate the chart series when the case requires.
-
Chart Animations for Smooth UX
The ASP.NET Core Charts offer intuitive built-in animations, boosting the user experience of your app. Hovering over the series name in the legend highlights the entire series in the chart. A click hides or shows it, so you and your users can focus on the data you need.
You can also make use of the chart-loading animations, interactive tooltips and cross-hair support for easy data visualization tracking.
-
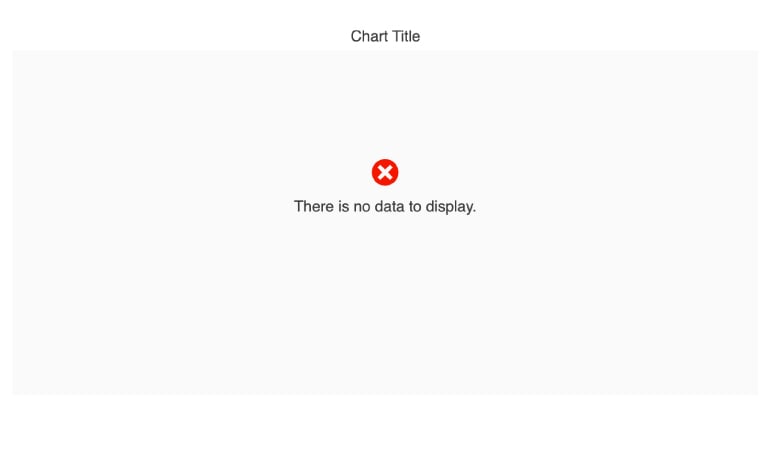
“No Data” Template
The “No Data” template in Telerik UI for ASP.NET Core Charts enables you to display a message when there is no data to show. This is beneficial in cases when loading data asynchronously, as it reassures users that data may appear after a delay. Customization of the “No Data” template is also available out-of-the-box—effortlessly add styling or interactive elements like buttons to improve usability.
See Telerik UI for ASP.NET Core Charts no data template demo
-
Data Binding: Server Side and Client Side
Use just a few properties to data bind the Telerik Core Charts, including binding to Web API endpoints, thanks to the Kendo UI DataSource component. Binding to local, remote or grouped data are all possible means to visualize your underlying source data in the chart. Show additional fields in the tooltips or labels by defining your own client template.
You can also use a JSON string or an array of JSON objects to change the datasource of the control on the client.
Learn more about ASP.NET Core Charts Data Binding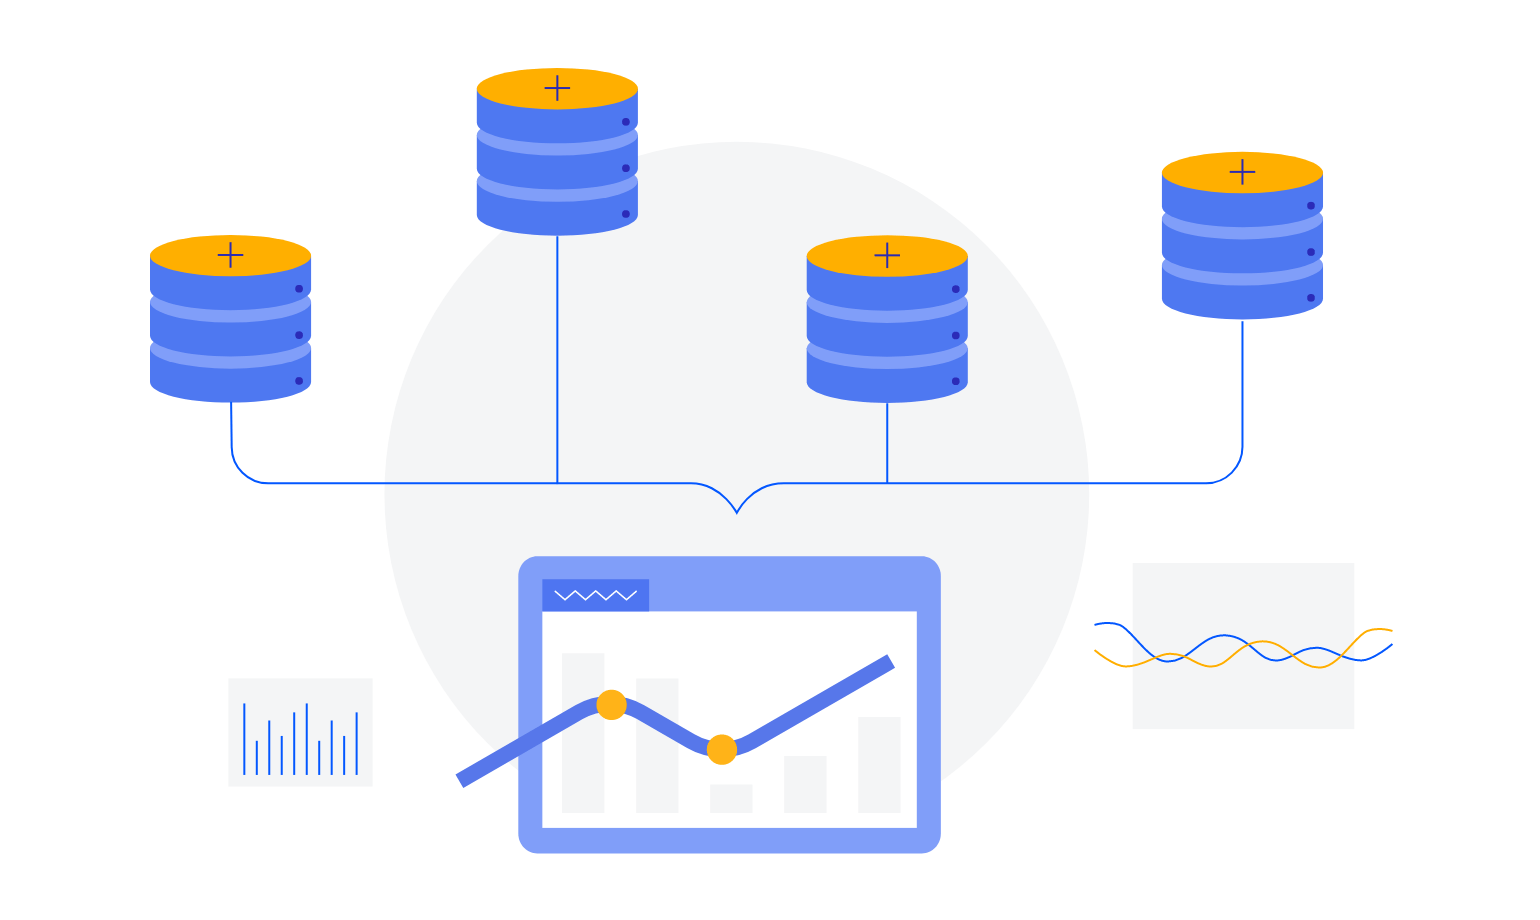
-
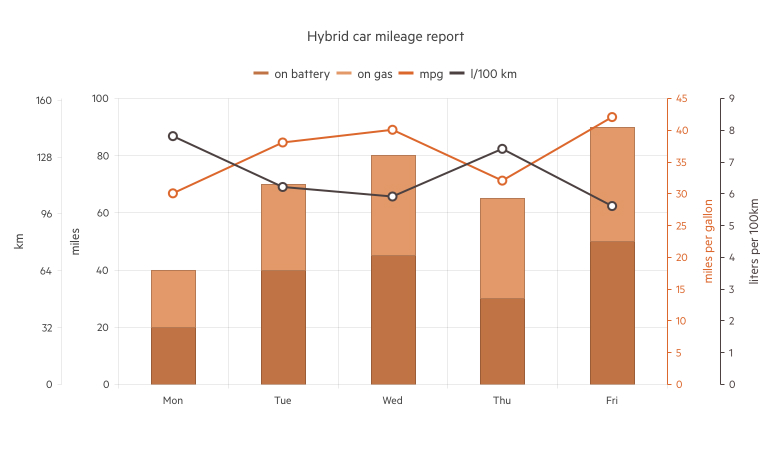
Multiple Series and Combination Charts
Provide multiple axes in a single chart, achieving a more comprehensive and informative data visualization. The Telerik UI for ASP.NET Core Chart also facilitates the freedom to combine similar chart types and scale the data against different measurements.
-
Plot Bands for ASP.NET Core Chart
With the ASP.NET Chart for Core, you can also offer Plot bands to indicate and display a value that spans across the entire chart and enables the users to see where each point in the series is in comparison.
See the ASP.NET Core BarChart Plot bands demo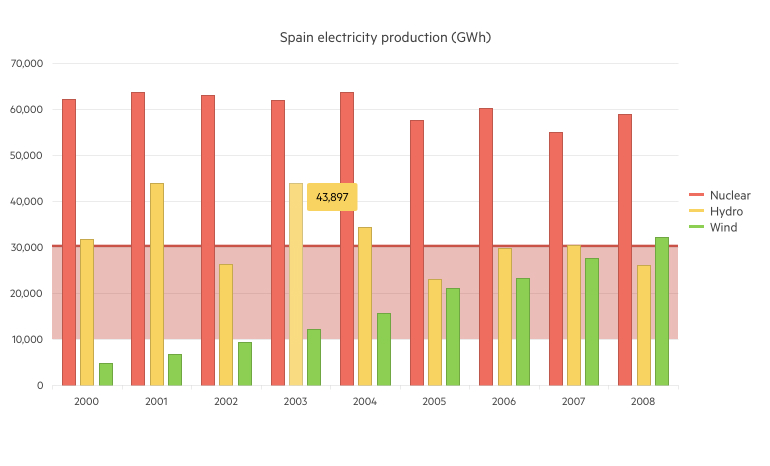
-
Server- and Client-Side API for Max Flexibility
Telerik UI for ASP.NET Core server-side Charts come with a complete server-side API. With simple API calls designed to feel natural in server-side languages, you can configure all features of the Core Charts. Since the server wrappers output the JavaScript, you also have full access to the client-side API for maximum control in the browser.

-
ASP.NET Core Chart Tag Helper
Adding advanced data visualization with a simple HTML-like syntax has never been easier thanks to the Chart’s support for Tag Helpers in ASP.NET Core.

-
Built-In Themes for Fast Styling
Apply any of the four sleek and ready-to-use built-in themes that come with Telerik ASP.NET for Core (Default, Material, Bootstrap, and Fluent). Easily create a consistent look and feel across your apps, while saving invaluable design and front-end development time.
And if you want to add a custom touch to your UI, you can simply customize the chart elements in the markup or use the Progress ThemeBuilder to build your own custom theme.
-
Also Available...
The Chart component is also available for these popular Web frameworks:
