Kendo UI for Vue
Vue Charts
- Add stunning data visualization to your apps with every chart type, tooltips, zooming and panning, interactivity, and much more.
- Part of the Kendo UI for Vue library along with 110+ professionally-designed components.
- Includes support, documentation, demos, virtual classrooms, learning resources and more!
-
Overview
The Vue Charts component delivers every chart type you will need from ordinary line and bar charts to complex stock and everything in between. Like the rest of the components in Kendo UI, each chart is built with performance, theming, customizability, and accessibility in mind.
-
Flexible Data Binding
The Vue Charts component makes it easy to bind data local or remote in various forms. This includes binding to simple arrays with X and Y values and into more advanced data types and objects with fields. Also included are several helpful configuration options for binding to dates. However you decide to bind your data, you can rest assured that performance is a priority.
-
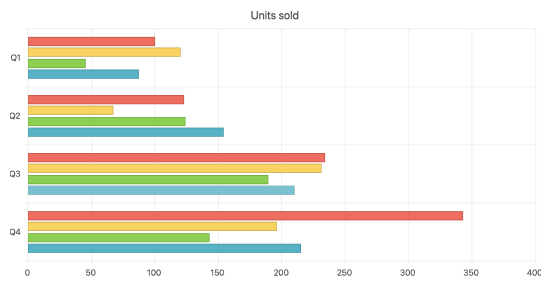
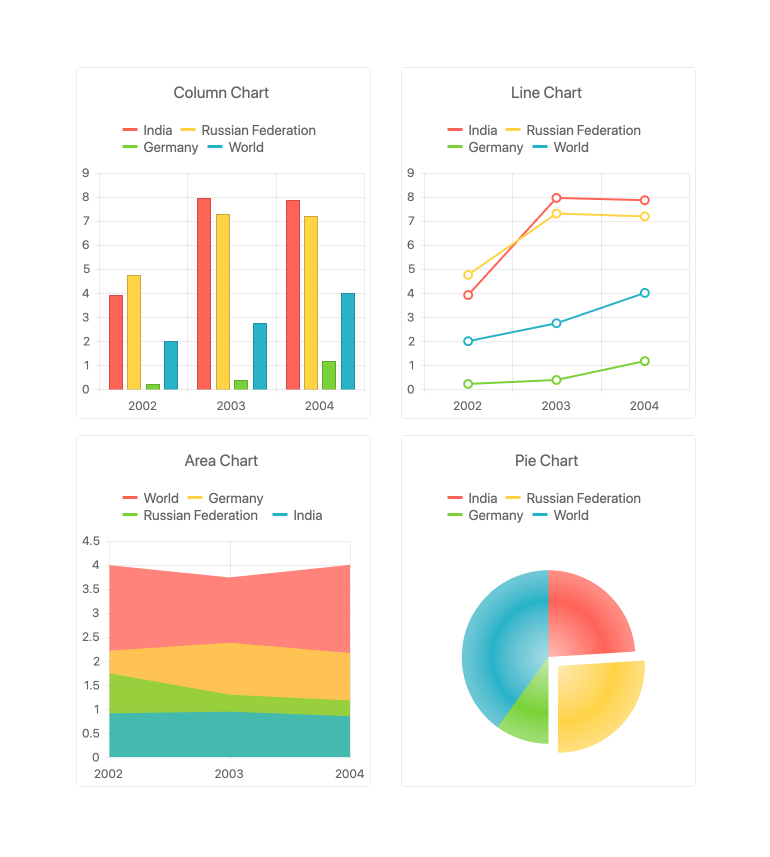
Virtually Every Chart Type
The Vue Charts components give you the choice of every popular chart and series type. You can use each series type independently or add multiple different series to a single chart, rendered together.
Available Vue Chart Types:
-
Chart Elements
The modular structure of the Kendo UI for Vue Charts allows you to easily isolate single parts of the Vue Chart component and customize them to fit your requirements. The component is broken down to various building blocks, including the axes, the chart area, labels, legends, plot bands and tile, just to name a few.
-
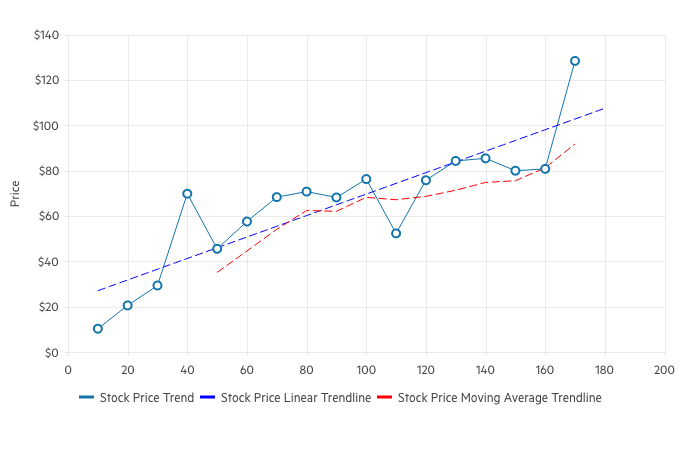
Trendlines
The Vue Trendlines are automatically generated indicators that illustrate data trends over time. Choose between the following trendline types:
- Linear trendline
- Exponential trendline
- Logarithmic trendline
- Power trendline
- Polynomial trendline
- Moving average
-
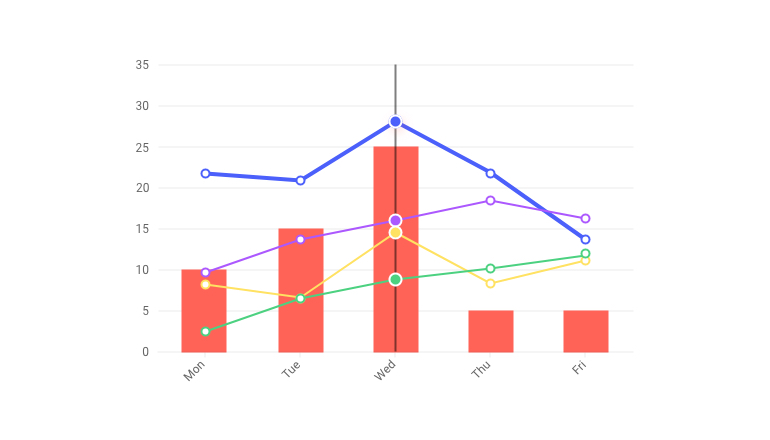
Multiple Axes and Chart Series on the Same Plot
The Vue Charts allow you can effortlessly accommodate scenarios that require multiple series in the same chart, including multiple axes showing different values and scales.All you need to do is define each series within the same chart and the component does the rest.
-
Panning and Zooming
The Vue Charts include tools for scenarios when datasets are too large to fit within one chart area due to screen real estate or chart element size. The built-in panning allows users to scroll horizontally over an axis, moving left and right, to navigate through large sets of data with ease. Zooming allows users to use the scroll wheel of a mouse or drag the mouse across an area to zoom in on a selected area.
-
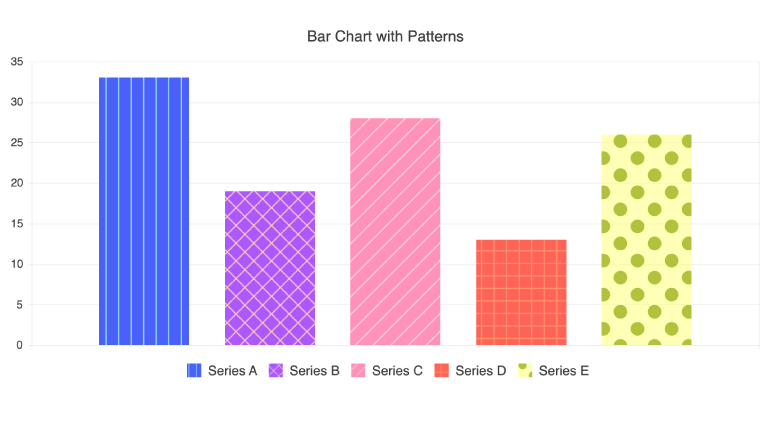
Pattern Fills
The Kendo UI for Vue Charts support customizable pattern fill of the chart series enabling you to spice things up by filling chart elements with different patterns such as diagonal stripes, dots or a grid pattern.
-
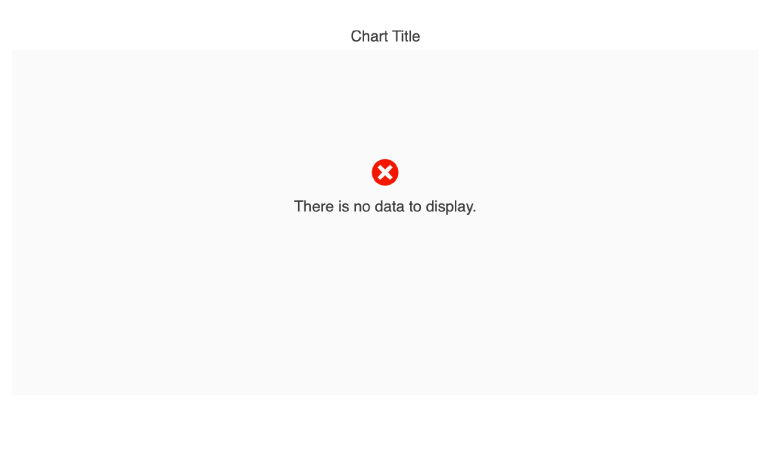
No Data Template
This ready-to-use template improves the user experience in those tricky empty-state scenarios when there is no data to visualize.
-
Chart Animations
Animate a series as it renders or animate real-time value changes to create an engaging user experience. The Kendo UI for Vue Charts come with built-in animations that are enabled by default. You don't have to do anything. It just works!
-
Canvas and SVG Rendering
The Vue Charts have support for both SVG and Canvas, allowing you to control which HTML element to use with a single configuration option.
-
Responsive Design Support
Display your charts on screens of any size. The Kendo UI for Vue Charts adapt to changes in the available viewport as users change the size of their browser. It automatically handles resizing like rotating labels on the axes, as well as fitting and wrapping content inside the chart area - all without the need to do calculations or update the rendering on your own.
-
Globalization
Much like the rest of the components in Kendo UI, the Vue Charts completely supports globalization and localization processes. Whether you need to translate labels, apply local symbols and formats, or display in right-to-left mode, we strive to make it as efficient as possible.

Get Started with Kendo UI for Vue