Kendo UI for Vue
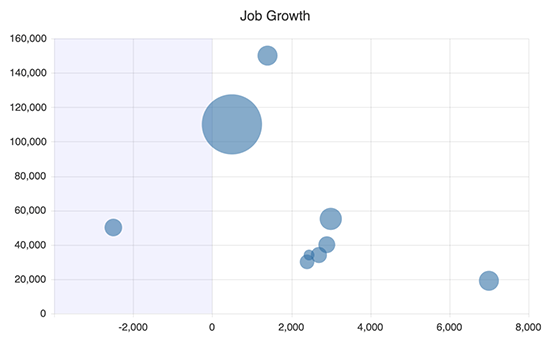
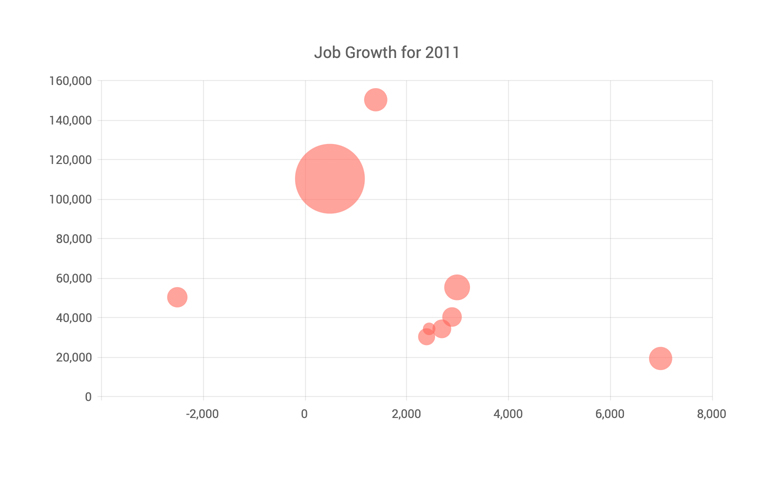
Vue Bubble Chart
- Display relationships between three or more numeric variables with the KendoVue Bubble Chart.
- Part of the Kendo UI for Vue library along with 110+ professionally-designed components.
- Includes support, documentation, demos, virtual classrooms, learning resources and more!
-
Build Powerful Data Visualizations with the Vue Bubble Chart
The Kendo UI for Vue Bubble Chart illustrates the connections among three or more numeric variables. It expands on the traditional scatter plot by adding a third numerical dimension whose value is proportionate to the size of its circle. Use the Vue Bubble chart when you need to visualize notably large differences and variations in the metrics to tell a compelling, multi-layered story.
-
Data Binding
You have the flexibility to fill the Vue Bubble Chart series with data from a range of source types, such as numbers, arrays, and objects (or models). You just need to specify the fields you intend to use.
-
Rendering
The Vue Bubble Chart showcases data in both Canvas (bitmap) and SVG (vector graphics) formats. SVG serves as the default format to ensure consistently sharp data presentations. For situations prioritizing performance, you can seamlessly switch to the canvas format via a single configuration option, ensuring your chart handles large datasets and real-time updates without interruptions.
-
Export Options
Export your Vue Bubble Chart to various formats such as PDF, SVG, PNG, and the Kendo UI drawing format. In scenarios requiring adjustments to image size or fitting the chart to a specific paper size when exporting to PDF, the component's intuitive export method preserves the quality and rendering of the Chart in the output file.
-
Themes
Customize the series colors of the Kendo UI for Vue Bubble Chart component using one of our predefined color sets, including Default (our own styling), Material (based on Material Design guidelines), Bootstrap (resembling Bootstrap styling), and Fluent (based on Microsoft Fluent UI). You can further personalize any of the built-in themes or create a new theme to match your brand's identity using Progress ThemeBuilder.
-
Globalization
The Kendo UI for Vue Bubble Chart provides support for globalization and localization to ensure the component effectively serves applications in various languages and locales. You can also enable right-to-left (RTL) rendering for languages with scripts read from right to left.


Get Started with Kendo UI for Vue