Kendo UI for Vue
Vue Funnel Chart
- Illustrate a decline or growth trend within your data using the KendoVue Chart.
- Part of the Kendo UI for Vue library along with 110+ professionally-designed components.
- Includes support, documentation, demos, virtual classrooms, learning resources and more!
-
Build Powerful Data Visualizations with the Vue Funnel Chart
The Kendo UI for Vue Funnel Chart illustrates the progression of data across various stages within a process. It visualizes the incremental or decremental advancement of a single data series, shaping a segmented funnel structure. Each segment of the funnel corresponds to a distinct value within your dataset, signifying a stage of the process and represented by a unique color. The Vue Funnel chart serves as an ideal tool for monitoring business metrics such as sales opportunities within a sales funnel or tracking leads throughout the customer journey.
-
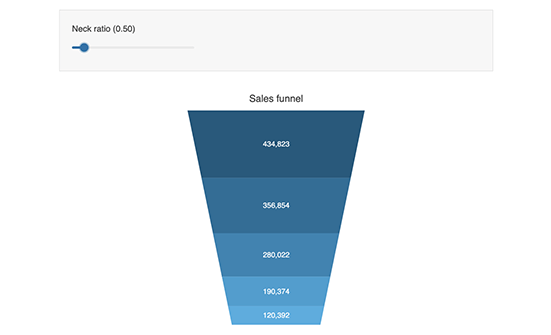
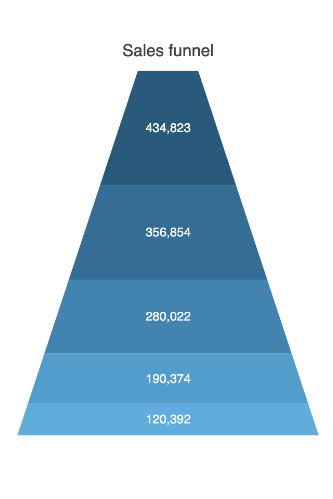
Funnel Shape
Tailor the configuration of the Vue Funnel Chart by specifying the neck-to-top ratio. By default, the neck ratio is established at 0.3, indicating that the base's width is 30% of the width at the top. Utilize the chart's ratio equalizer feature to modify this ratio, allowing you to shape the funnel according to your application's requirements. You can also flip the funnel upside down, transforming it into a pyramid shape if needed.
-
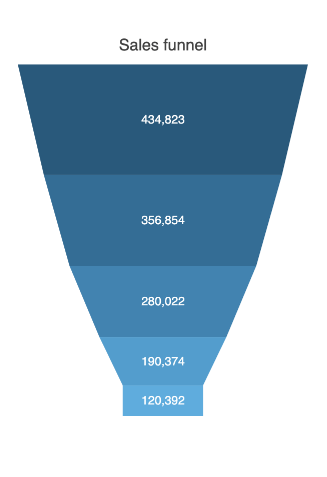
Dynamic Slope and Height
You can choose to have a freeform representation of the funnel shape by enabling the dynamic slope and height of the Vue Funnel Chart. That will render each segment of the funnel is a size relative to the value it represents.
-
Data Binding
You can populate the Vue Funnel Chart series with data from various source types, including numbers, arrays and objects (or models)—simply specify the fields you want to use during configuration.
-
Rendering
The Vue Funnel Chart showcases data in both Canvas (bitmap) and SVG (vector graphics) formats. SVG serves as the default format to ensure consistently sharp data presentations. For situations prioritizing performance, you can seamlessly switch to the canvas format via a single configuration option, ensuring your chart handles large datasets and real-time updates without interruptions.
-
Export Options
Export your Vue Funnel Chart to various formats such as PDF, SVG, PNG, and the Kendo UI drawing format. In scenarios requiring adjustments to image size or fitting the chart to a specific paper size when exporting to PDF, the component's intuitive export method preserves the quality and rendering of the Chart in the output file.
-
Themes
Customize the series colors of the Kendo UI for Vue Funnel Chart component using one of our predefined color sets, including Default (our own styling), Material (based on Material Design guidelines), Bootstrap (resembling Bootstrap styling), and Fluent (based on Microsoft Fluent UI). You can further personalize any of the built-in themes or create a new theme to match your brand's identity using Progress ThemeBuilder.
-
Globalization
The Kendo UI for Vue Funnel Chart provides support for globalization and localization to ensure the component effectively serves applications in various languages and locales. You can also enable right-to-left (RTL) rendering for languages with scripts read from right to left.


Get Started with Kendo UI for Vue