UI for ASP.NET Core
ASP.NET Core Stock Chart
- Visualize the price movement of any financial instrument over a certain period of time with the ASP.NET Core StockChart.
- Part of the Telerik UI for ASP.NET Core library along with 120+ professionally designed UI components.
- Includes support, documentation, demos, virtual classrooms, Visual Studio Code Extensions and more!
-
Overview
The Stock Chart is a powerful data visualization component, which allows you to graphically represent your data. The component is designed for those of you developing financial projects as it displays changes in the price of a financial unit over time, such as the daily values of a stock price for the past month. The component supports various series types, such as Candlestick, Open-high-low-close, Column and more.
See the ASP.NET Core Stock Chart demo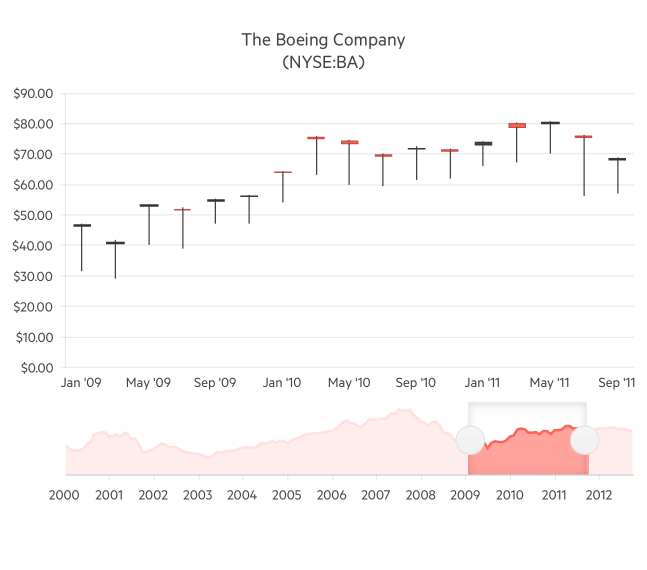
-
Data Binding
The Stock Chart is a data-bound component, which allows its data series to contain extra information, such as the values at the start and the end of the trading day, the respective max/min values and a DateTime field for the x axis. Furthermore, the Telerik UI for ASP.NET Core StockChart provides two types of binding models—the single data source model and the master and navigator data source model.
-
Chart Types
The ASP.NET Core Stock Chart component supports the following series types:
- Candlestick to describe price movements
- OHLC (Open-high-low-close) to illustrate price movements over time
- Column to show volume
- Line to clearly visualize trends
- Area to show price movements during a longer time span
-
Multiple Panes
For a better representation of data, you can add multiple graph panes. A pane can be defined through the Panes collection, setting its title and height to your requirements. You can easily zoom in and out or scroll through data to adjust the time period you want to be displayed.
Explore the Telerik UI for ASP.NET Core Stock Chart Multiple Panes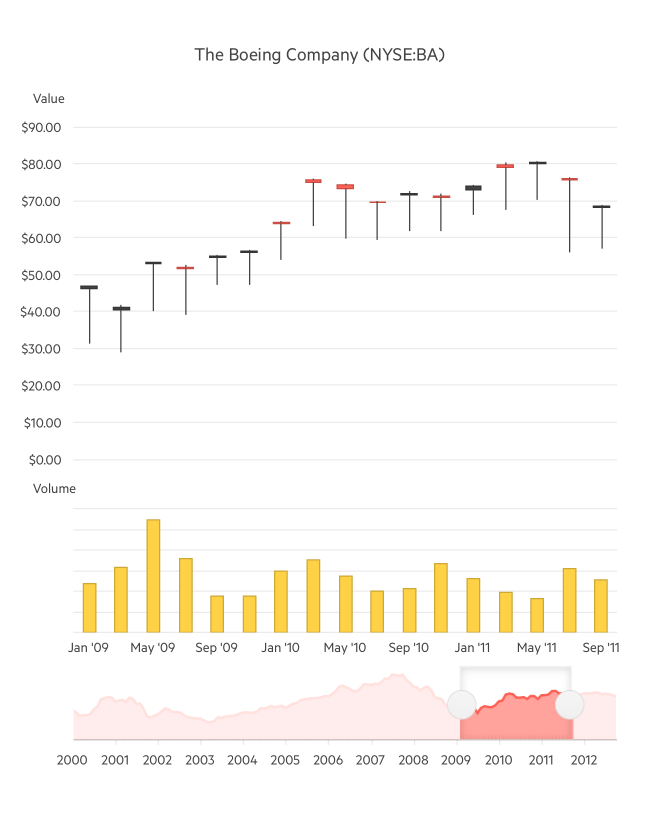
-
Crosshairs
The StockChart Crosshairs are a pair of lines, intersecting at the current mouse position, which provide a visual cue for the user to zoom in on a single data point and read its value. When working with large datasets in long time spans, Crosshairs allow you to see the precise values, not only the bigger picture. -
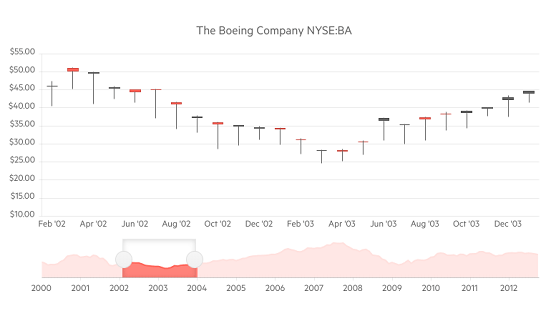
Navigator
The Navigator is a part of the ASP.NET Core Stock Chart component. It lets users navigate all the information in the chart by jumping to a date they find interesting and narrowing down the time period to see fine-grained details and extract valuable information. Following you specific app requirements, you can easily position the Navigator on top or at the bottom of the Stock Chart.
See the Telerik UI for ASP.NET Core StockChart Navigator demo
-
PDF Export
Charts are very useful when conducting research or trying to understand how the stock price will fluctuate. When you need to save a certain Stock Chart and refer to it later in time, the Stock Chart offers a PDF export option, which can be easily configured with the PDF export settings of the Telerik Core Charting helper. When exporting the document, you can specify Author, Creator, Date, FileName, AllPages, PaperSize and more print settings. -
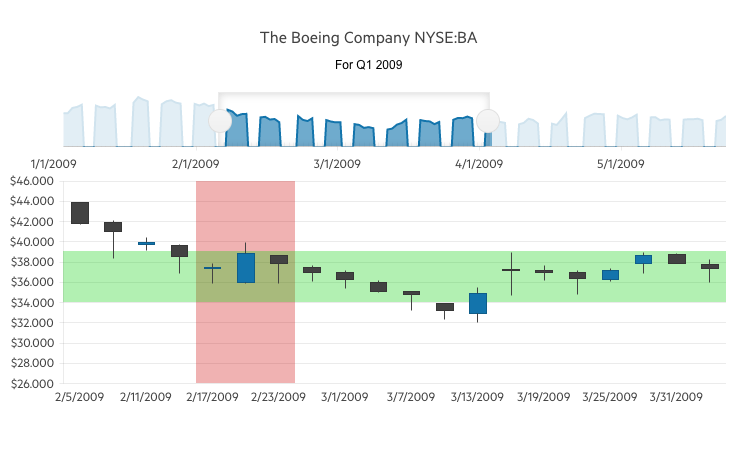
Analyze Historical Stock Prices
The ASP.NET Core Stock Chart is a combination of Line and Candlestick charts, representing historical stock prices. The Low and High prices of the stock for the period are represented by the bottom and top values of the vertical line, while the Open and Close prices are represented by the bottom and top values of the candlestick bar. The rise or fall of the Open and Close prices is indicated by the color of the candlestick, so you can analyze the data with one quick look.
-
Theming
The Stock Chart has several built-in themes, including Default (our own styling), Material (based on the Material Design guidelines), Bootstrap (which looks like the Bootstrap styling) and Fluent (based on Microsoft Fluent UI). You can easily customize any of the out-of-the-box themes with a few lines of CSS or create a new theme to match your colors and branding by using the Telerik SASS ThemeBuilder application.