UI for ASP.NET Core
ASP.NET Core HeatMap
- Display a multitude of indicative color values with the Telerik UI for ASP.NET Core HeatMap Chart.
- Part of the Telerik UI for ASP.NET Core library along with 120+ professionally designed UI components.
- Includes support, documentation, demos, virtual classrooms, Visual Studio Code Extensions and more!

-
Overview
The Telerik UI for ASP.NET Core HeatMap Chart is a data visualization component used to display values as color in two dimensions. It allows users to easily visualize and compare values that are measured often or even every day such as temperatures, sales, number of orders, etc. The component features crosshairs, different shapes, color scales, PDF export, panning and zooming, category binding, tooltips and various theming options.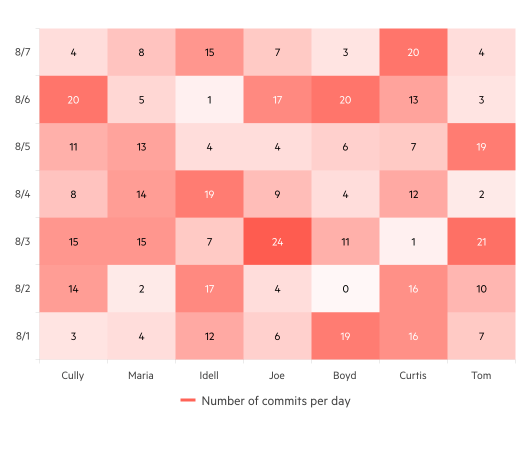
-
HeatMap Shapes
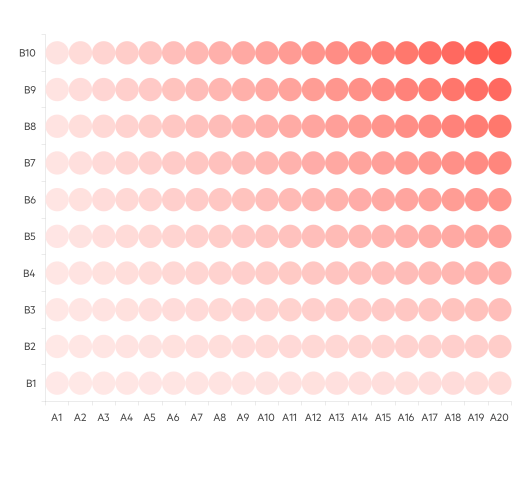
With the ASP.NET Core HeatMap Chart, you can visualize data in different shapes:
- Circles
- Rectangles
- Rounded rectangles
- Triangles
- Custom
-
Color Scales
The component uses indicative colors to visualize the values on the Chart. Each color changes its lightness depending on the value itself. It can vary from white to a fully filled-in color to best illustrate the data and allow users to spot the lowest and highest data points with just one glance.
Visit the HeatMap Chart Color Scheme demo -
Tooltip
In order to closely explore each value displayed on the HeatMap chart, we have incorporated a tooltip allowing users to hover over the value of interest to see more information. The tooltip’s color changes along with the color of the selected value for a better UX.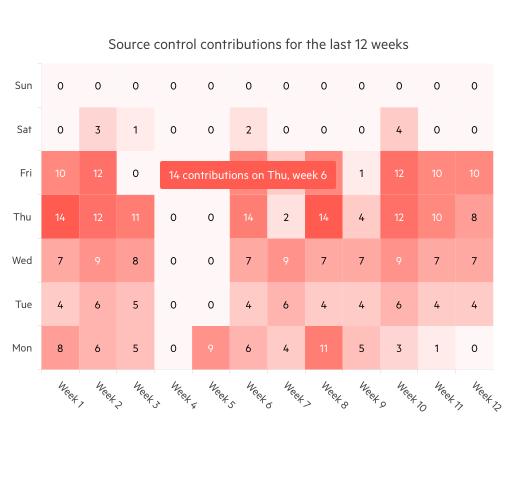
-
Crosshairs
The Telerik UI for ASP.NET Core HeatMap crosshairs are a pair of lines, intersecting at the current mouse position, which provide a visual cue for the user to focus on a single data point and read its value. When working with large datasets in long time spans, crosshairs allow you to see the precise values, not only the bigger picture. -
Export to PDF
Charts are essential for data visualization and analysis and are often included in reports and presentations. That is why the ASP.NET Core HeatMap chart can be easily exported to a PDF file and included in any report. -
HTML and Tag Helpers
Telerik UI for ASP.NET Core provides two ways to declare UI components—by using HTML or Tag helpers. You can choose between the two approaches based on your technological background or personal preferences and practice and implement the ASP.NET Core HeatMap in your applications.
-
HeatMap Theming
The Telerik UI for ASP.NET Core HeatMap component has several built-in themes and swatches you can chose from. Explore the Default (our own styling), Material (based on the Material Design guidelines), Bootstrap (which looks like the Bootstrap styling to integrate better) and Fluent (based on Microsoft Fluent UI) themes and choose the swatch that meets your design requirements.
If neither of the available themes and swatches satisfies your needs, you can easily customize them with a few lines of CSS or create new themes by using the Progress SASS ThemeBuilder application.