
KendoReact
React Scatter Chart
- Visualize data correlations with the KendoReact Scatter Chart.
- Part of the KendoReact library along with 120+ free and paid enterprise-grade UI components.
- Includes legendary technical support, design resources, comprehensive documentation, demos, and more!
-
Create Powerful Scatter Charts with KendoReact
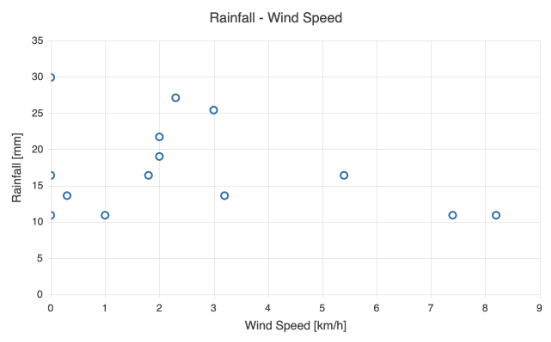
The KendoReact Scatter Chart is a numerical data visualization that displays data points as dots over the plot area. The component effectovely illustrates the relationship between two numerical variables. It is ideal for showcasing the correlation of numeric variables in data analysis. The KendoReact Scatter Chart offers a wealth of features, including a built-in legend, series colors, tooltips, and more.
-
Line Style
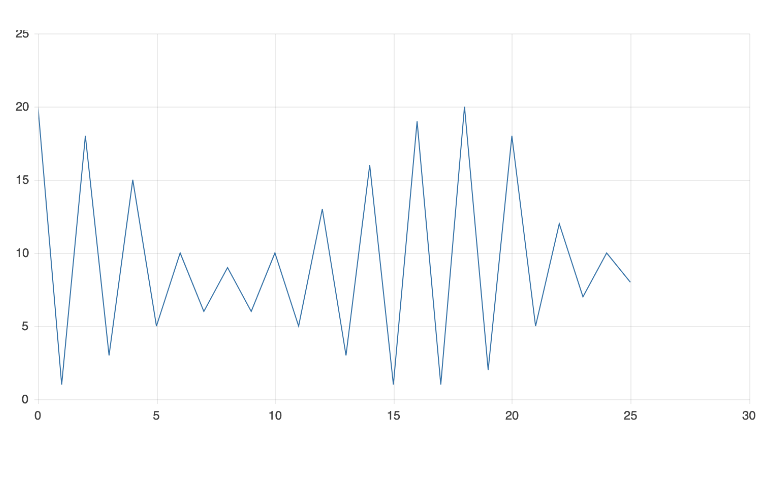
The KendoReact Scatter Line Chart enables you to choose between a standard line (the default style, including a straight line between the data points) and a smooth style (featuring a fitted curve through data points) for your scatter lines. You can set the line style by simply using the chart’s style property.
-
Panning and Zooming
Utilize the built-in panning and zooming capability to empower users to focus on specific sections of the KendoReact Scatter Chart. The component makes use of a drag motion for panning and a mouse wheel or pinch-and-zoom motions for zooming. Moreover, you have the option to disable the panning and zooming for a given axis to prevent users from moving vertically or horizontally across the chart plot area.
-
Export Options
You can easily export your React Scatter Chart to PDF, SVG, PNG and the Kendo UI drawing format. In case you need to adjust the image size or fit the chart to a particular paper size, the user-friendly export method will enable you to preserve the chart’s quality and rendering in the output file.
-
Appearance
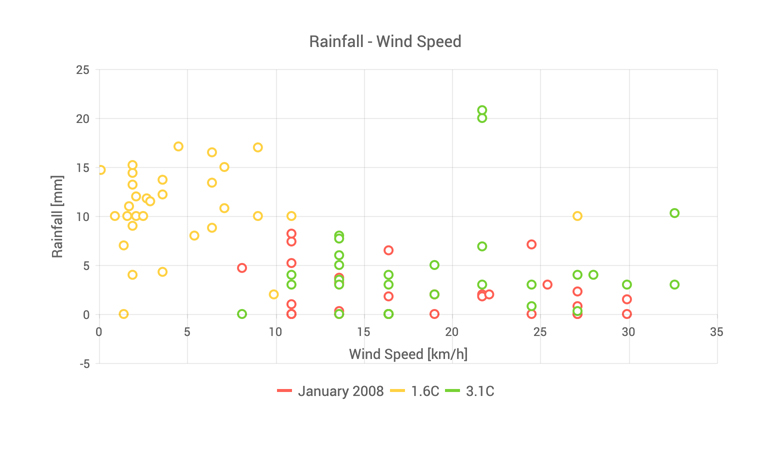
Modify the series colors of the KendoReact Scatter component with one of our predefined color schemes, including Default (our own style), Material, Bootstrap and Fluent. Additionally, you have the flexibility to fine-tune any of the built-in themes or craft a completely new theme to reflect your brand identity using the Progress ThemeBuilder.
-
Globalization
The KendoReact Scatter Chart provides globalization and localization capabilities to ensure effective support for different languages and locales within your React app. Additionally, you have the option to utilize the right-to-left (RTL) support for languages that use right-to-left scripts.

