
KendoReact
React Bullet Chart
- Easily compare two related values against each other with the KendoReact Bullet Chart.
- Part of the KendoReact library along with 120+ free and paid enterprise-grade UI components.
- Includes legendary technical support, design resources, comprehensive documentation, demos, and more!
-
Build Dynamic Data Visualizations with a Customizable React Bullet Chart
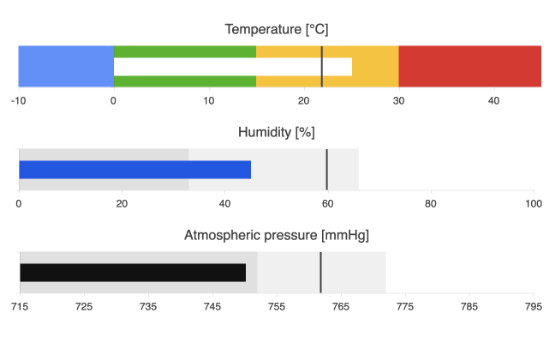
The KendoReact Bullet Chart facilitates the comparison of two related values by using a horizontal bar and a vertical line. The component uses one value as a benchmark (e.g. total product sales for the past year) and contrasts it to another numerical value, like the sales of the product for the current year. To provide more context, the comparison is linked to a qualitative category, such as a breakdown by region. Ideal for showcasing progress towards a specific goal or performance against a reference line.
See the React Bullet Chart demo
-
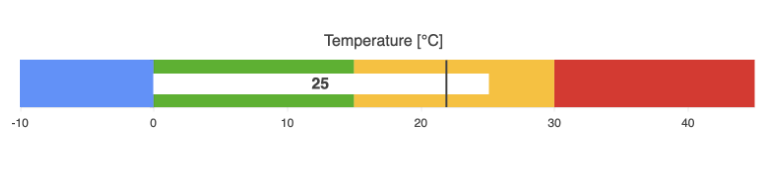
Bullet Chart Label Configuration
To display labels for the React Bullet Chart value, simply add a ChartSeriesLabels configuration component to the series.
-
Data Binding
You can easily fill the React Bullet Chart series with data originating from different sources, such as numbers, arrays, and objects. You just need to specify the desired fields during the configuration process.
See the React Bullet Chart data binding demo
-
Rendering Modes
The React Bullet Chart can render data in both Canvas and SVG (vector graphics) formats. SVG is the default format used to guarantee a crips data presentation. However, when you need to prioritize performance, you can easily transition to a canvas format with a single configuration option. This will ensure your React chart can handle large amounts of data and real-time updates.
See the React Bullet Chart rendering demo
-
Export Options
The React Bullet Chart can be exported to PDF, SVG, PNG and the Kendo UI drawing format. The user-friendly export method enables you to preserve the chart quality and rendering in the output file in cases when you need to change the image size or fit the chart to a paper size.
-
Themes
The component enables you to easily customize the series colors by using one of our predefined color sets, including Default (our own styling), Material (based on the Material Design guidelines), Bootstrap (resembles the Bootstrap styling) and Fluent (based on Microsoft Fluent UI). Furthermore, the Progress ThemeBuilder allows you to personalize any of the built-in themes or create a completely new theme to match your brand identity.
See the React Bullet Chart appearance demo
-
Globalization
The KendoReact Bullet Chart supports globalization and localization capabilities to deliver effective support any application’s language and locale. Additionally, you have the option to enable the right-to-left (RTL) rendering for languages that use right-to-left scripts.

