KendoReact
React Sankey Diagram
- Easily create diagrams that visualize changing flows and their distribution between domains.
- Part of the KendoReact library along with 120+ free and paid enterprise-grade UI components.
- Includes legendary technical support, design resources, comprehensive documentation, demos, and more!
-
Overview
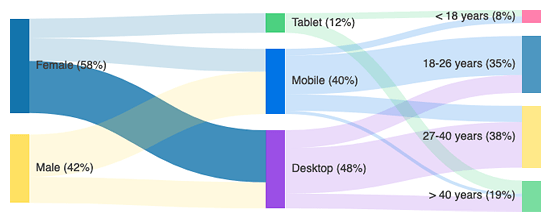
The KendoReact Sankey Chart enables you to easily create diagrams that visualize changing flows and their distribution between domains. The Sankey diagrams are ideal for a variety of use cases, including website traffic, budget breakdowns, energy flow, and more.
The component incluse a variety of customizable elements, including:
- Nodes
- Links
- Labels
- Legend
- Title
- Tooltip
-
AutoLayout
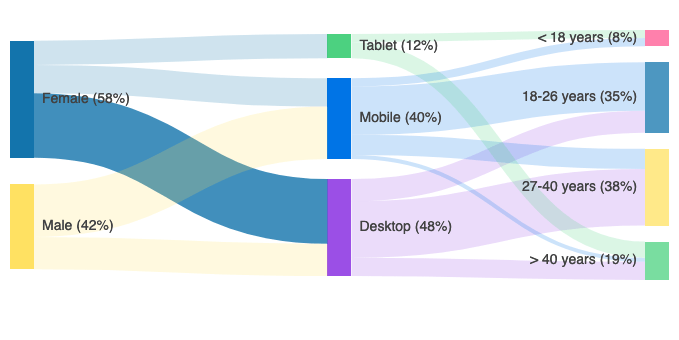
The component automatically rearranges the nodes and their corresponding links for improved visual appearance and readability.
-
Export Options
The Sankey diagram includes built-in support for Image, PDF, and SVG export.
-
Customization
You have multiple options to customize the KendoReact Sankey diagram:
- By configuring the properties for all Sankey diagram elements
- By using the data property to apply the desired styles to specific instances
- By using the style property to apply component-wide styles
-
Events
The KendoReact Sankey Diagram generates different events enabling you to tailor the component behavior based on your needs:
- onNodeEnter – fires when the users enters a node
- onNodeLeave – fires when the user leaves a node
- onLinkEnter – fires when the user enters a link
- onLinkLeave – fires when the user leaves a link
-
Accessibility
The Sankey Diagram comes with built-in accessibility support, enabling users with disabilities to fully utilize its capabilities. The component is compliant with WCAG 2.2 AA standards and Section 508 requirements.