
KendoReact
React Area Chart
- Illustrate trends over time with the KendoReact Area Chart .
- Part of the KendoReact library along with 120+ free and paid enterprise-grade UI components.
- Includes legendary technical support, design resources, comprehensive documentation, demos, and more!
-
Easily Construct Data Visualizations using the React Area Chart
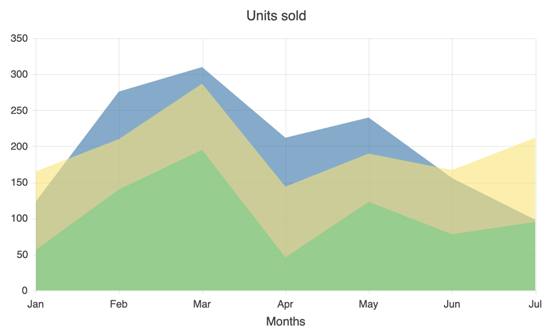
The KendoReact Area Chart displays variations in data values from related categories over a certain period of time. It helps you to visually compare how two or more data sets or subsets develop over time by plotting a series of connected data points for each set and stacking them on top of each other. Each series is characterized by a continuous line and a color for the area underneath the line, enabling you to easily notice any differences in data distribution and identify notable trends within numerical data.
-
React Area Chart Types
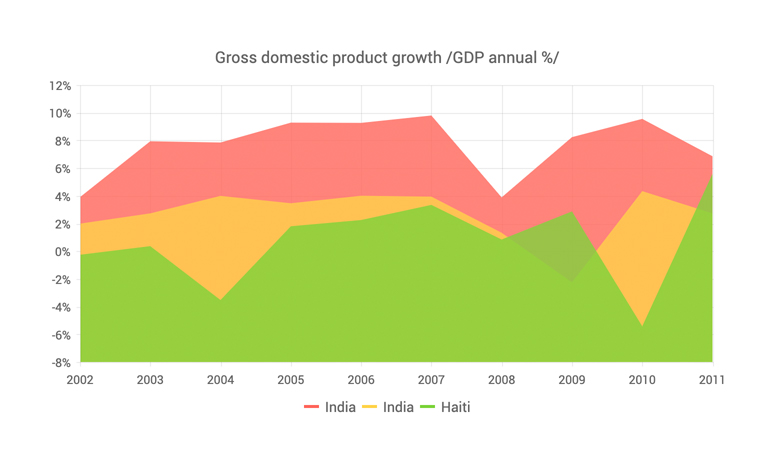
The component consists of two sub-types - Stacked Area chart and 100% Stacked Area chart. With the React Stacked Area chart, you can easily display the series using numeric values. The 100% Stacked Area chart, on the other hand, allows you to present each series as a percentage of the total. You can conveniently apply your preferred area chart type by setting the Stack property to true or type:100% object, respectively.
-
Data Binding
The React Area Chart can utilize data from a range of source types, such as numbers, arrays and objects (or models) - just specify the desired fields.
-
Series Line Style
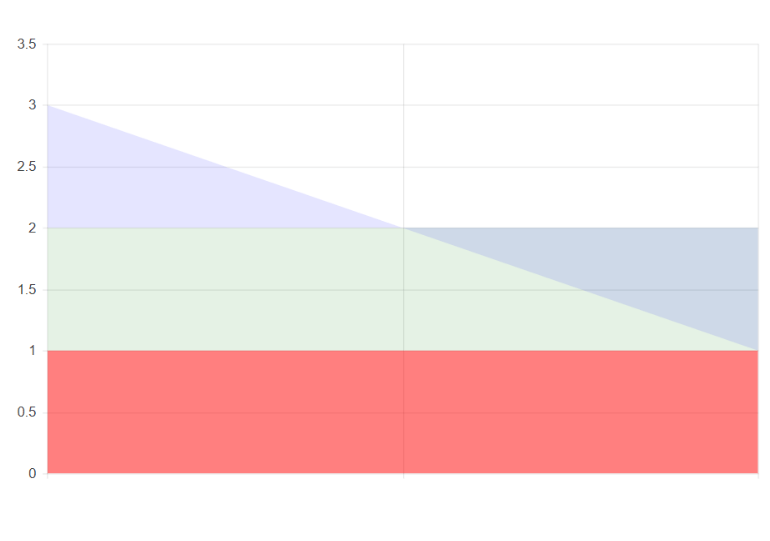
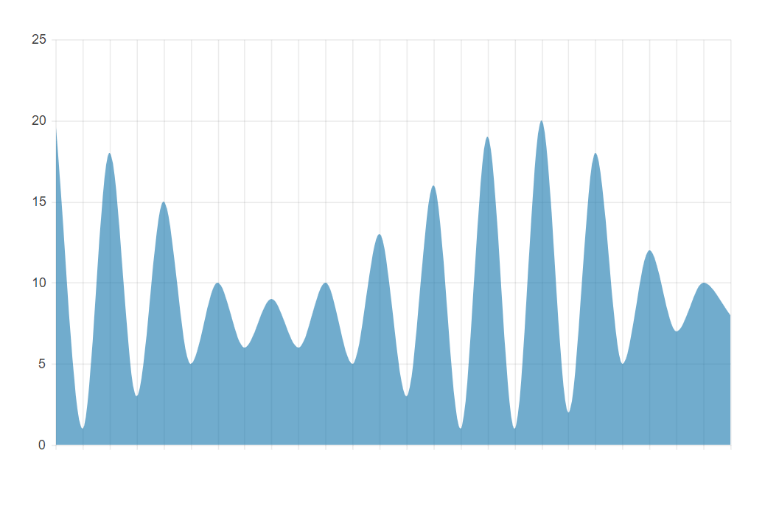
Tailor the appearance of the connecting line that links the data points within each React Area Chart series. You have the option to select various line styles, including normal (default, straight line), step (horizontal and vertical lines) and smooth (fitted curve).
-
Rendering Modes
The React Area Chart depicts data in both Canvas (bitmap) and SVG (vector graphics) formats. SVG is the default choice to guarantee a crips presentation of your data. If prioritizing performance, you can utilize the canvas format with a single configuration option. This will ensure your React chart can manage substantial data and real-time updates without any interruptions.
-
Export Options
The React Area Chart can be exported to PDF, SVG, PNG, and the Kendo UI drawing format. In case you need to adjust the image size or fit the chart to a specific paper size during PDF export, the user-friendly export method will preserve the quality and rendering of the Chart in the output file.
-
Panning and Zooming
The component includes a built-in pan and zoom functionality, enabling users to focus on specific ranges within the chart. The drag motion is used for panning, while a mouse wheel and pinch-and-zoom motions are used for zooming. Additionally, you have the ability to disable panning and zooming for a specific axis in order to prevent users from moving vertically or horizontally across the chart plot area.
-
Themes
The KendoReact Area Chart enables you to customize the series colors with one of our predefined color sets, including Default , Material, Bootstrap and Fluent. Additionally, you can adjust any of the built-in themes or set up a completely new theme to reflect your branding with the Progress ThemeBuilder.
-
Globalization
The React Area Chart component supports globalization and localization features, ensuring compatibility with the desired language and locale of your React app. You can also utilize the right-to-left (RTL) support for languages that are read from right to left.

