
KendoReact
React Pie Chart
- Visualize a category breakdown in a 360-degree circle with the KendoReact Pie Chart.
- Part of the KendoReact library along with 120+ free and paid enterprise-grade UI components.
- Includes legendary technical support, design resources, comprehensive documentation, demos, and more!
-
Customizable React Pie Chart for Effective Data Presentations
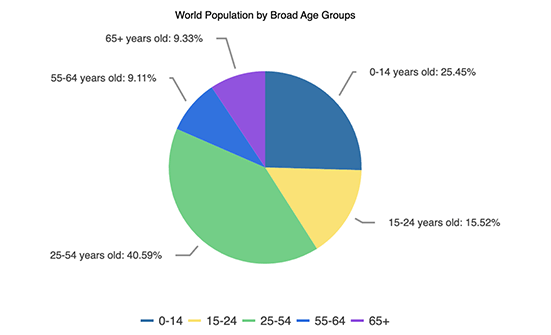
The KendoReact Pie Chart displays data as sections in a circular graph format. It is ideal for visualizing series as parts of a whole, where each category is represented by a slice within the circle, resembling a pie. The entire pie represents 100% and each slice conveys the proportional size of its category to the total. The component offers multiple configuration options for labels, tooltips, legend and styling.
-
React Pie Chart Labels
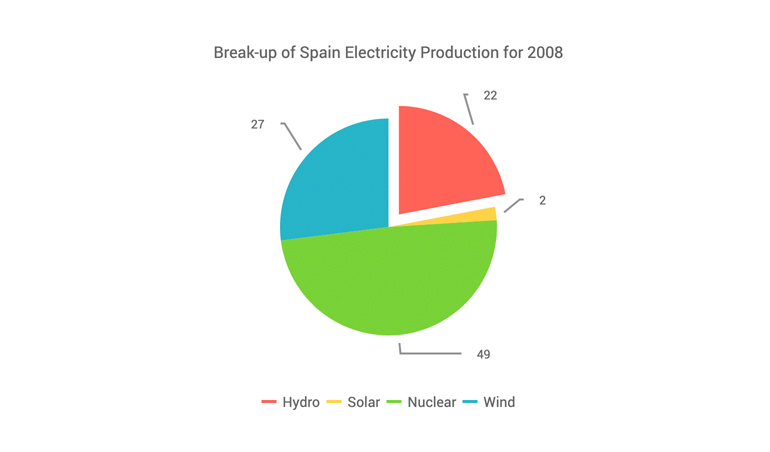
You can easily configure the labels of the React Pie Chart series to be aligned either in a circle or in columns outside the chart. The autofit setting enables you to avoid clipping the labels’ content from the plot area. Additionally, you have the flexibility to hide all or individual labels, which will exclude the respective category’s share from the chart’s total division.
-
Rendering Modes
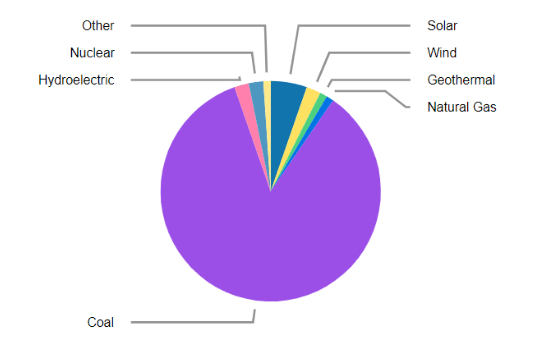
The React Pie Chart can render data in both the Canvas and SVG formats. By default, the SVG format ensures an always crips data presentation. When prioritizing performance, you can easily switch to a canvas with a single configuration option. This will ensure your React Pie chart can handle large amounts of data and real-time updates without any issues.
-
Export Options
You have the option to easily export your React Pie Chart to PDF, SVG, PNG and the Kendo UI drawing format. When there is a need to adjust the image size or fit the chart to a specific paper size, the user-friendly export method will enable you to keep the chart’s quality and rendering in the output file.
-
React Pie Chart Appearance
Tailor the series colors of the KendoReact Pie Chart component using one of our predefined color sets, including Default (our own styling), Material (based on the Material Design guidelines), Bootstrap (resembles the Bootstrap styling) and Fluent (based on Microsoft Fluent UI). Additionally, you have the flexibility to customize any of the built-in themes or craft a completely new theme that perfectly aligns with your brand using the Progress ThemeBuilder.
-
Globalization
The KendoReact Pie Chart component offers globalization and localization capabilities, ensuring compatibility with various language and locales within your React app. Additionally, you can utilize the right-to-left (RTL) support for languages that use right-to-left scripts, such as Arabic and Hebrew.

