
KendoReact
React Range Area Chart
- Visualize a range that changes over time with the KendoReact Range Area Chart.
- Part of the KendoReact library along with 120+ free and paid enterprise-grade UI components.
- Includes legendary technical support, design resources, comprehensive documentation, demos, and more!
-
Create Compelling Visualizations with the KendoReact Range Area Chart
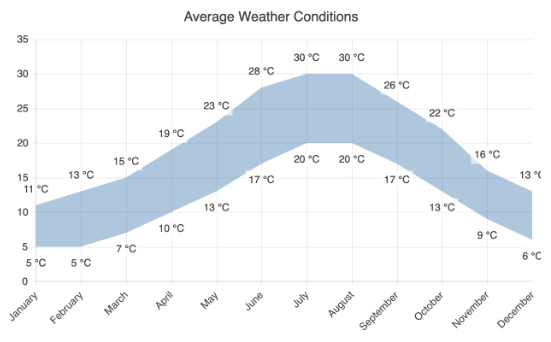
The KendoReact Range Area Chart visually represents an area between the low and high values of a variable as it evolves over time. The area space between the upper and the lower values is filled with color and the X-axis typically represents a timeline. The React Range Area Chart is ideal for illustrating value ranges, such as the fluctuation between minimum and maximum prices over a specific period of time.
-
Panning and Zooming
Utilize the built-in panning and zooming capability to allows users to focus on particular sections of the KendoReact Range Area Chart. The component makes use of a drag motion for panning and a mouse wheel or pinch-and-zoom motions for zooming. Furthermore, you have the option to disable panning and zooming for a given axis to restricts users from navigating vertically or horizontally within the chart plot area.
-
Range Area Rendering Modes
The React Range Area Chart can render data in both Canvas and SVG formats. By default, the SVG format ensures an always crips presentation of your data. However, when prioritizing performance, you can easily switch to a canvas format with a single configuration option. This will ensure your chart can handle substantial amounts of data and real-time updates without any issues.
-
Export Options
You have the flexibility to easily export your React Range Area Chart to PDF, SVG, PNG and the Kendo UI drawing format. In case you need to adjust the image size or fit the chart to a particular paper size, the user-friendly export method will enable you to preserve the chart’s quality and rendering in the output file.
-
Appearance
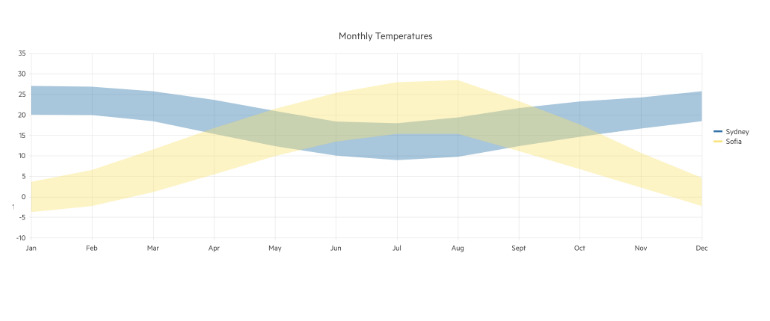
Tailor the series colors of the KendoReact Range Area component with one of our predefined color sets, including Default, Material, Bootstrap and Fluent. For even greater customization, you can further customize any of the built-in themes or craft a completely new theme to reflect your brand identity using the Progress ThemeBuilder.
See the React Range Area Chart appearance demo
-
Globalization
The KendoReact Range Area Chart supports globalization and localization capabilities to ensure effective support for various languages and locales within your app. Additionally, you can utilize the right-to-left (RTL) support for languages that use right-to-left scripts.

