
KendoReact
React Bubble Chart
- Showcase relationships between three or more numeric variables with the KendoReact Bubble Chart
- Part of the KendoReact library along with 120+ free and paid enterprise-grade UI components.
- Includes legendary technical support, design resources, comprehensive documentation, demos, and more!
-
Create Dynamic Data Visualizations with the Flexible React Bubble Chart
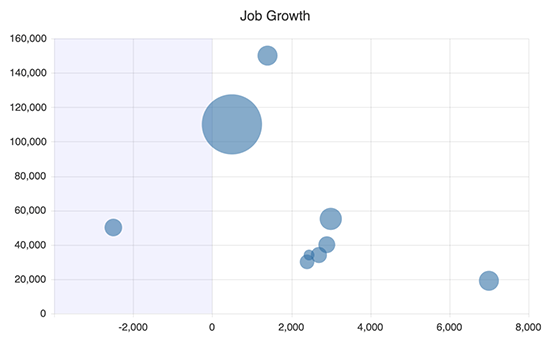
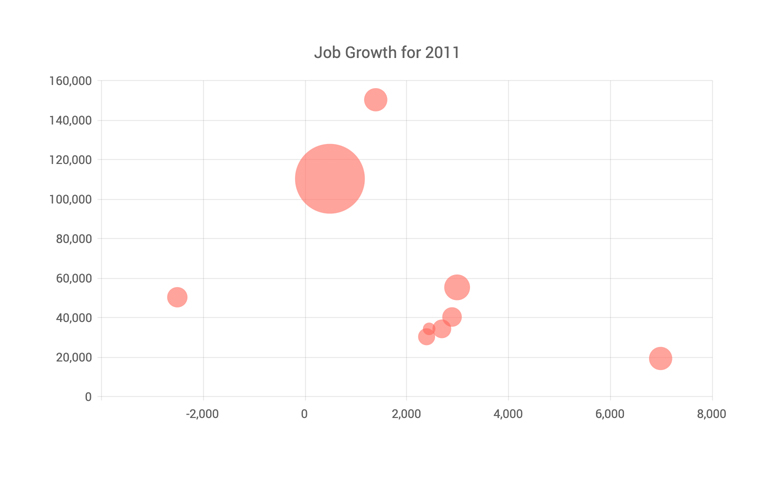
The KendoReact Bubble Chart is designed to show the relationships between three or more numeric variables. It extends the capabilities of the traditional scatter plot by introducing a third numeric dimension whose value corresponds to its circle size. Utilize the React Bubble chart when you need to showcase significant differences and variations within the metrics to tell a compelling story.
See the React Bubble Chart demo
-
Data Binding
Easily populate the React Bubble Chart series with data from different types, including numbers, arrays and objects. This can be achieved by simply specifying the desired fields you need to use as part of the configuration process.
See the React Bubble Chart data binding demo
-
Rendering Modes
The React Bubble Chart can render data in both the Canvas (bitmap) and SVG (vector graphics) formats. By default, the SVG format ensures a crips presentation of your data. In case the performance is your main priority, you can easily transition to a canvas format with a single configuration option. This will make sure your React chart can effectively manage substantial amount of data and real-time updates.
See the React Bubble Chart rendering demo
-
Export Options
Exporting the your React Bubble Chart to PDF, SVG, PNG and the Kendo UI drawing format is made easy. If you need to adjust the image size or fit the chart to a paper size as part of the export, the intuitive export method enables you to keep the quality and rendering of the Chart in the output file.
See the React Bubble Chart export demo
-
Themes
Personalize the series colors of the KendoReact Bubble component by selecting one of our predefined color schemes, including Default (our own styling), Material (based on the Material Design guidelines), Bootstrap (resembles the Bootstrap styling) and Fluent (based on Microsoft Fluent UI). For an even greater level of customization, you have the option to modify any of the built-in themes or craft a completely new theme that fully aligns with your brand identity using the Progress ThemeBuilder.
See the React Bubble Chart appearance demo
-
Globalization
The KendoReact Bubble Chart component includes globalization and localization options to ensure seamless compatibility with the preferred application’s language and locale. You also have the option to enable the right-to-left (RTL) support for languages that use right-to-left scripts.
See the React Bubble Chart globalization demo

