
KendoReact
React Box Plot
- Visualize data distribution in quartiles with the KendoReact Box Plot Chart.
- Part of the KendoReact library along with 120+ free and paid enterprise-grade UI components.
- Includes legendary technical support, design resources, comprehensive documentation, demos, and more!
-
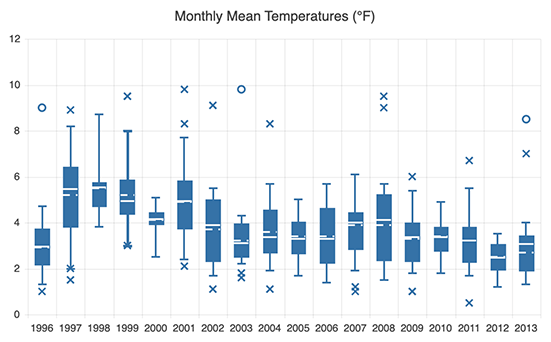
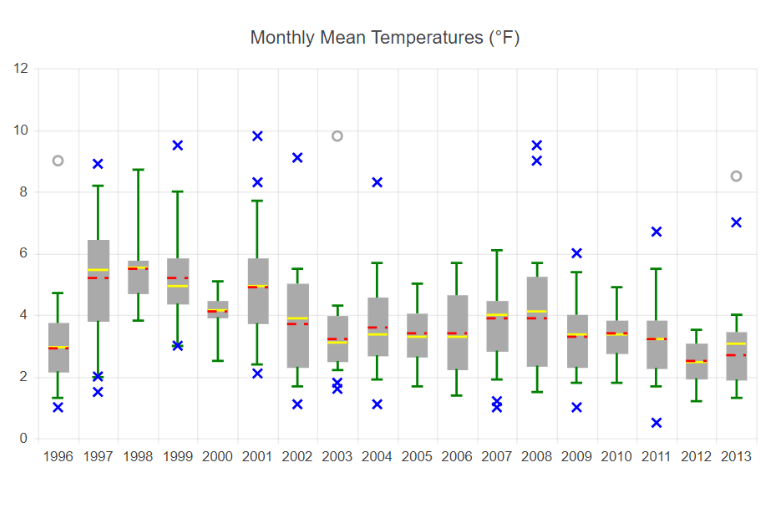
Build Powerful Data Visualizations with the React Box Plot
The KendoReact Box Plot serves the purpose of showcasing data distribution against six key metrics: lower or minimum value, first quartile, median, mean, third quartile and upper or maximum value. It helps you to compare distributions between multiple groups or datasets, see how the values are spread out and spot outliers for each data series. The component is also a great way to tell if your data is symmetrical or skewed. Its compact design facilitates the visualization of a large number of datasets within a limited space.
-
Data Binding
Easily populate the React Box Plot series with data originating from different sources, such as numbers, arrays and objects (or models). You just need to specify the desired fields you need to utilize.
-
Rendering Modes
The React Box Plot chart displays data in the Canvas (bitmap) and SVG (vector graphics) formats. By default, the SVG ensures a consistently crips presentation of your data. When optimizing for performance, you have the option to switch to a canvas format with a single configuration option. This transition ensures your React chart will be able to manage substantial amounts of data and real-time updates without any issues.
-
Export Options
Easily export your React Box Plot to PDF, SVG, PNG and the Kendo UI drawing format. If you need to adjust the image size or fit the chart to a paper size when exporting to PDF, the user-friendly export method will ensure the quality and rendering of the Chart remain intact in the resulting output file.
-
Themes
Tailor the series colors of the KendoReact Box Plot component by utilizing a variety of predefined color schemes, including Default, Material, Bootstrap, and Fluent. For a more personalized touch, you can benefit from any of the built-in themes or create an entirely new theme to match your branding with the Progress ThemeBuilder.
-
Globalization
The KendoReact Box Plot supports globalization and localization features to ensure seamless compatibility with language and locale preferences for your React aoo. The component also offers right-to-left (RTL) rendering for languages that use right-to-left scripts.
See the React Bar Chart globalization demo

