
KendoReact
React PivotGrid
- The React Pivot Grid comes with powerful features, including filtering, sorting, a configurator interface and more.
- Part of the KendoReact library along with 120+ free and paid enterprise-grade UI components.
- Includes legendary technical support, design resources, comprehensive documentation, demos, and more!
-
Create Multidimensional Data Visualizations
Expand the reporting capabilities of your dashboard in no time with the React Pivot Grid (also called Pivot Table). This interactive component enables your user to cross-intersect and summarize table data in multiple ways and use advanced calculations. You can data-bind the KendoReact Pivot Grid to an OLAP service and customize it extensively.
-
Filtering
With filtering enabled, the React Pivot Grid component can be manipulated to display only data matching specific criteria set by the user. The user can enjoy lightning-fast Pivot Table response and a variety of filtering options, including filtering of specific values, using operators (e.g. "contains" or "starts with") or filtering by a pre-defined field, such as a time period. Filtering can be applied to both rows and columns. The KendoReact PivotGrid supports filtering via XMLA access to the OLAP Cube service.
-
Sorting
Through the sorting functionality of the React Pivot Table, users can choose to sort a single column or multiple columns and show data in an ascending or descending order. This sorting feature can be enabled on any data type in the PivotGrid such as date, geography or KPI. Sorting can be added with a single property that enables users to sort by clicking the header of a column or row. Clicking multiple times allows users to sort the items in an ascending and descending order or no sort order at all (removing any applied sorting).
-
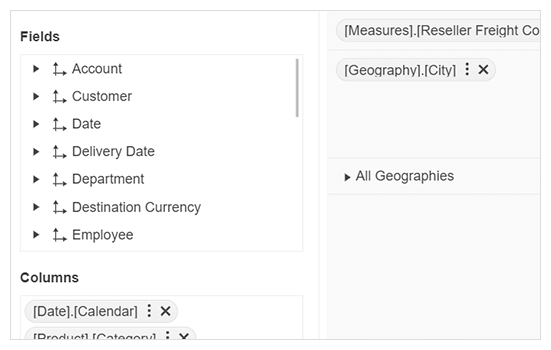
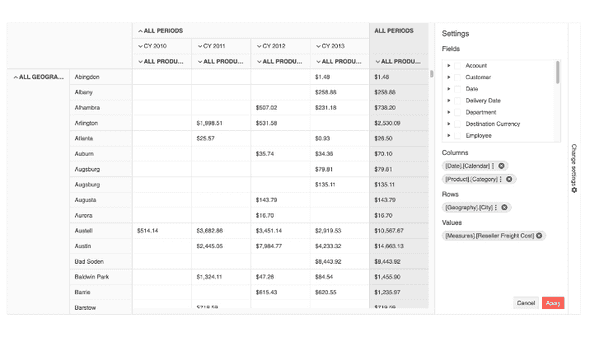
Configurator
To make interacting with the React Pivot Grid intuitive and easy for end-users, the component offers a configurator interface. This configurator is a list of fields through which users can apply modifications such as filtering and what fields to pivot against. Since the configurator is key in the UX of the Pivot Grid - a sort of an admin panel for the user - it is built to be highly customizable to be able to match your app's design and meet various requirements. For example, developers have the flexibility of replacing nested elements or entire components used in the configurator (such as the React Editor, React Form and FormElement) with custom components.
-
Customization
You can customize many aspects of the React Pivot Table: from applying custom width and height to specific rows and columns to providing custom components. Each cell, row and column can have a custom look, and this also applies to the header row and columns.
-
Data Binding
The React Pivot Grid component supports data binding to local data or to an Online Analytical Processing (OLAP) cube. Developers can pull or create data within the client and bind it directly to the React PivotGrid component, depending on the application requirements. OLAP allows access to data that is aggregated and organized in a multidimensional structure called a "cube." OLAP tools enable users to interactively perform analysis over multidimensional data. You can also refer to our article on how to setup an OLAP cube if you have questions around it.
See the React Pivot Grid data binding article
-
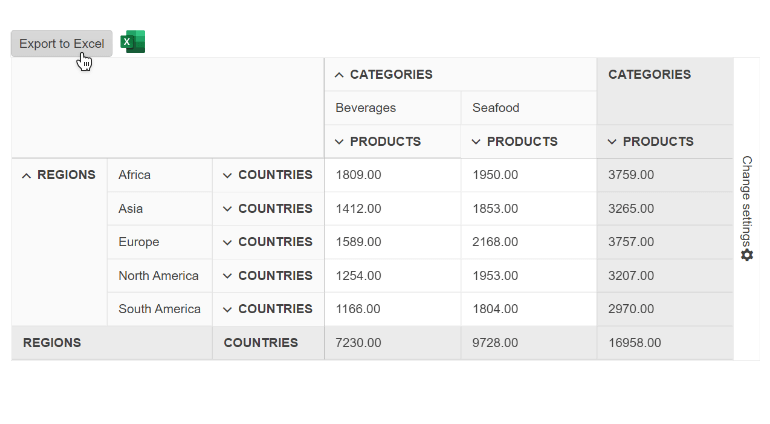
Export to Excel
Whenever your users have to edit the React PivotGrid data in a standalone spreadsheet instead of inside your React app, you can use the built-in export to Excel functionality of the KendoReact PivotGrid. When enabled, users can export the component’s content with a single click.
-
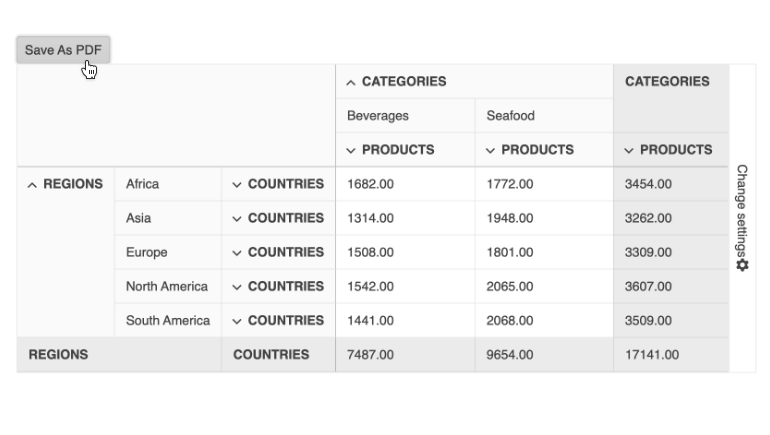
Export to PDF
It’s easy to give end-users the ability to export the content of your React PivotGrid to a PDF file: Just enable the functionality. You can take advantage of different options to configure the exported PDF file. One popular configuration option is choosing whether only the current page or all content should be exported when a user attempts to export to PDF.
-
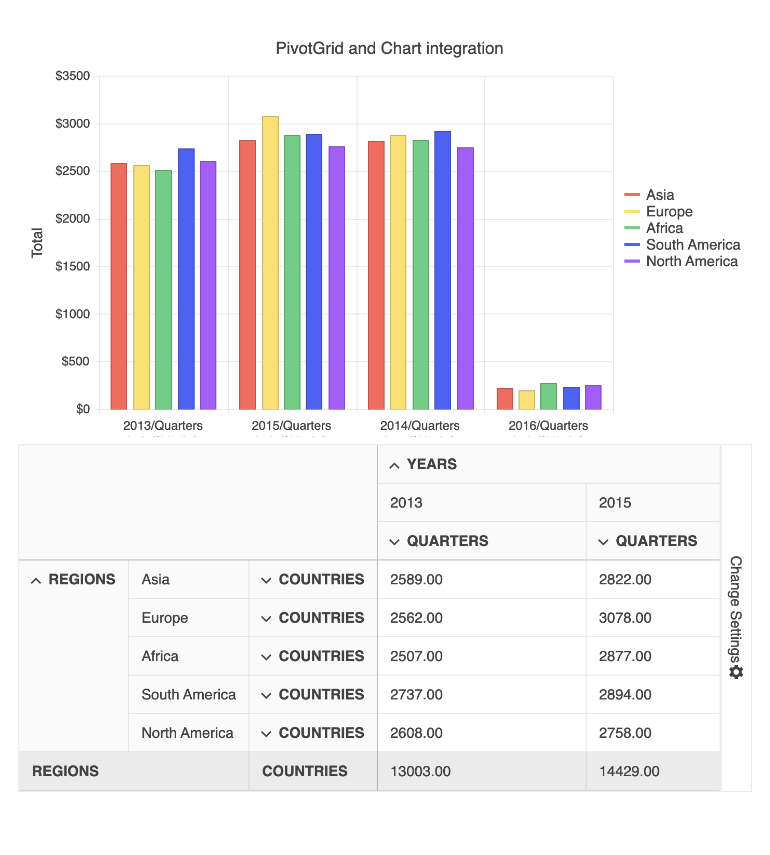
PivotGrid and Chart Integration
Displaying data visually using charts and data visualizations is a powerful way for end-users to better understand the data they are working with. For this purpose, you can take advantage of the smooth integration between the React PivotGrid and React Charts available in the KendoReact UI library. For example, whenever data operations such as sorting or filtering are done in the Pivot Grid, the Chart will automatically update.
-
Styling & Themes
As with every KendoReact component, the React PivotGrid comes with three out-of-the-box themes: Bootstrap, Material and Kendo UI Default. Each theme can be used as-is, or customized by taking advantage of the available Sass variables to make it your own. To make customization even easier, there is also the KendoReact ThemeBuilder which can create a custom theme with just a few clicks.
