
UI for WPF
WPF 3D Chart
- The Telerik UI for WPF 3D Chart is a charting component that enables three-dimensional data visualization.
- Part of the Telerik UI for WPF library along with 165+ professionally-designed UI controls.
- Includes support, documentation, demos, virtual classrooms, Visual Studio Extensions and more!
-
3D Data Visualization
Telerik WPF 3D Chart control is an addition to the RadChartView set and is the first control in it to visualize data in a three dimensional manner. The chart uses the WPF API for 3D rendering, so you don’t need to worry about including third party libraries.
-
DataBinding
The control features the well-known WPF data binding mechanism via ItemSource and defining the properties in it to be utilized for the different data points in the chart. In addition, there is a convenient dynamic data binding mechanism that will automatically create series based on the data in the hierarchical data source (collections of collections).
-
Data Sampling
The data sampling functionality is very useful when working with large data sets, as the component engine will automatically execute data sampling on the provided data set, to reduce the number of points that the chart needs to render, without losing valuable information.
-
Series Types
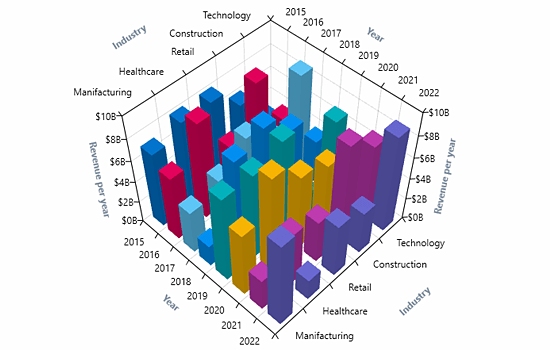
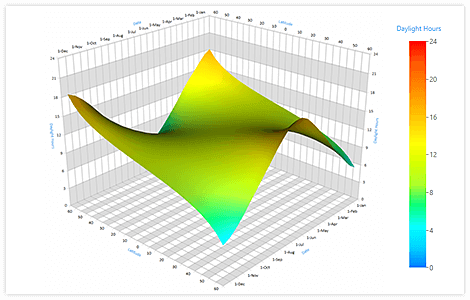
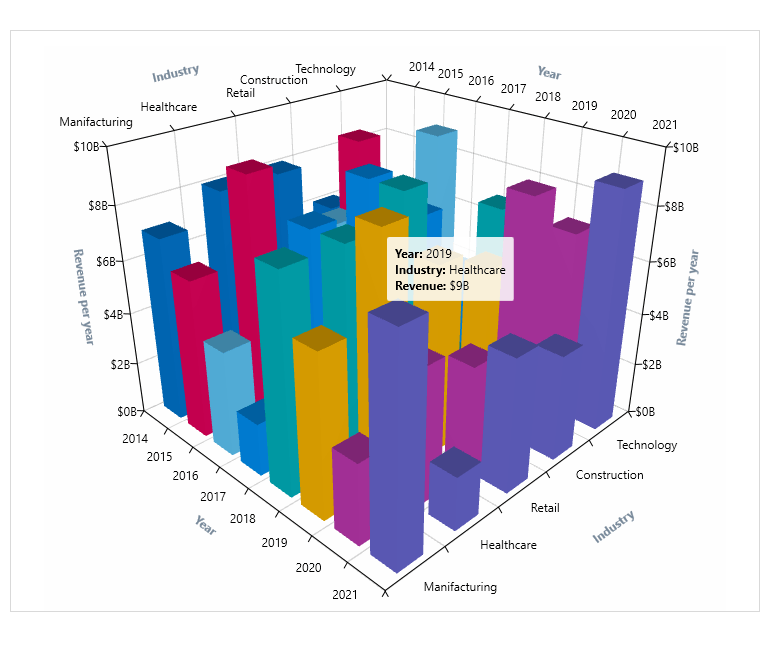
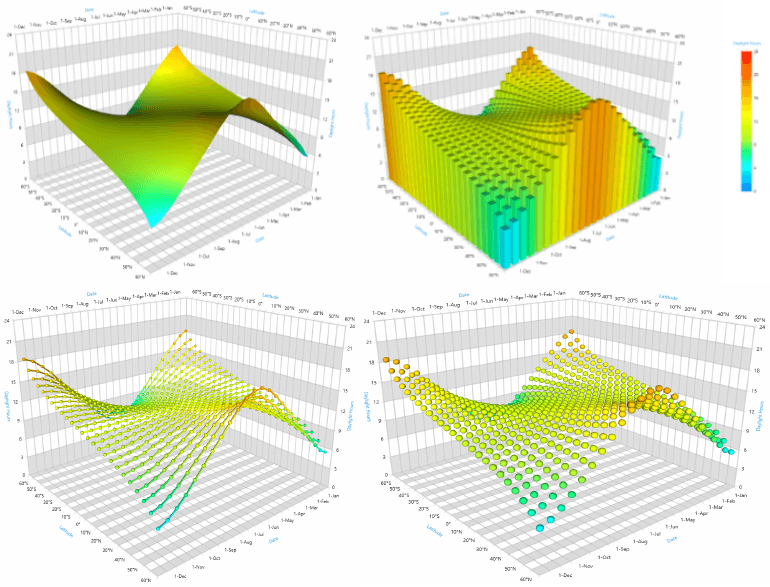
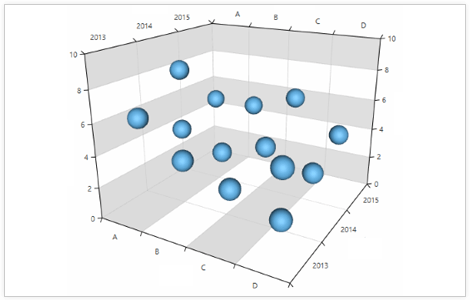
There are three built-in series in the 3D chart—surface series, point series, and bar series (a.k.a. Manhattan chart).
- Point Series – allows for point size selection
- Surface series – exposes advanced features such as different color modes and custom triangulation abilities.
- Bar Series - ability to specify the display direction of the bars
- Line Series - visualizes three dimensional data represented by a line shape
-
Axes
The 3D space in the RadCartesianChart3D control is defined by three axes, one for each dimension – X, Y and Z.
Two axis types that can be used with the 3D chart:
- Numeric
- Categorical
-
Camera behavior
The chart allows you to control the camera position from where the scene is observed. You can rotate the camera around the chart and change its distance, by moving it towards or away from the center. This creates the illusion that the chart is being spun and zoomed in and out.
Documentation on the Telerik UI for WPF 3D Chart Camera Behavior -
Palettes
The control supports a variety of color palettes. You can explore all available options in the Demo app of Telerik UI for WPF.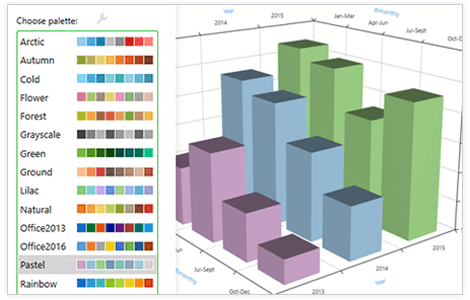
-
Tooltips
The tooltip behavior shows information about hovered data point visuals.
Documentation on the Telerik UI for WPF 3D Chart Tooltip Behavior -
Data Point Customization
You can control the appearance of the data point visuals. Set custom materials allowing to determine the color, gloss and shine of the 3D elements, as well as other customizations. Additionally, custom geometries can determine the shape of the visuals.
Check out the Telerik UI for WPF Demo Applications to see the components in action
