UI for WPF
WPF Spreadsheet
- Enjoy virtually no limitations on the number of cells in a sheet, providing unmatched performance-even with thousands of cells with the Telerik UI for WPF Spreadsheet.
- Part of the Telerik UI for WPF library along with 165+ professionally-designed UI controls.
- Includes support, documentation, demos, virtual classrooms, Visual Studio Extensions and more!
-
MS Excel-Like Authoring
Provide Microsoft Excel-like authoring and editing in your applications with a smooth familiar interface for your end-users.
-
Workbook and Worksheet Protection
Full support for Workbook protection allows you to ask for a password if users want to delete, add or rename worksheets. Worksheet protection allows you to apply a set of options that define what the user can do within the worksheet. You can allow users to change certain perimeters such as column weight and lock others such as row height for example. You also can make certain cells read-only to prevent users form changing their content. -
Support for XLSM
Since R3 2021, the Telerik UI for WPF Spreadsheet now support working with XLSM files. In addition to XLSX, XLS, CSV, TXT and PDF, we’ve added support for XLSM files without working with macros. Macros won’t be stripped from your file; however, they won’t be active in applications.
Telerik UI for WPF Spreadsheet Documentation -
Images Support
RadSpreadsheet allows your application users to easily insert and format images in their worksheets. -
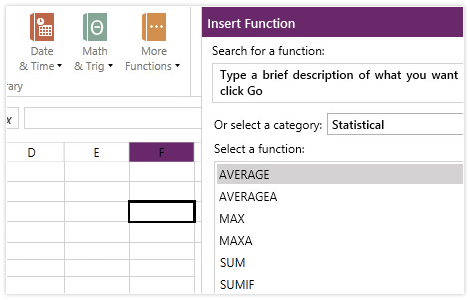
Formulas
There are more than 100 built-in formulas, covering a broad range of categories, which can meet even the most demanding requirements, including:- Financial formulas
- Statistical formulas
- Engineering formulas
-
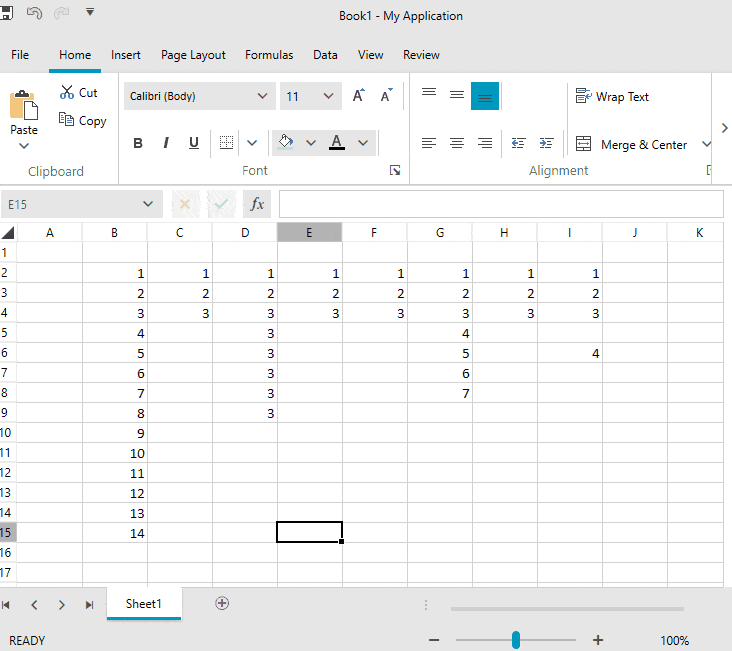
Sorting and Filtering
Organize and search data easily. Get a better understanding of data spanning across multiple rows and columns and quickly analyze data with the sorting functionality.
The filtering functionality enables you to add flexibility to your data. Display and focus on the data that you need at any given moment, without breaking its initial structure and content.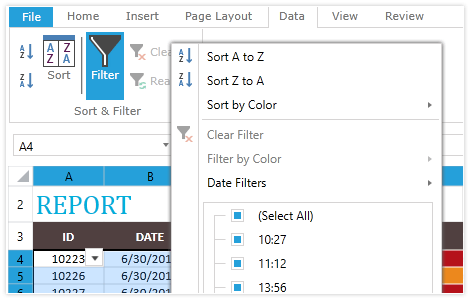
-
Copy/Paste
Copy-paste cells from a sheet with their formatting, using different paste options, all neatly organized in a drop-down in the ribbon view.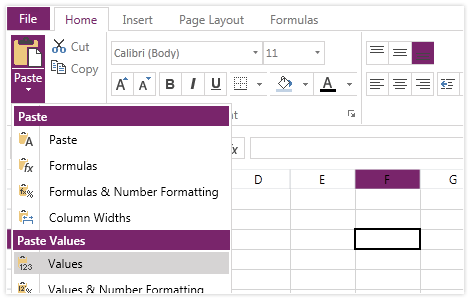
-
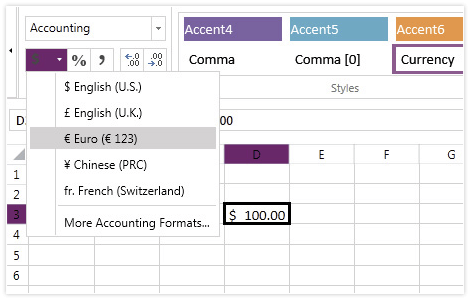
Number Formats
Manipulate, create and represent data in a variety of formats using any of the options for displaying numbers that RadSpreadsheet for Silverlight provides. All the main number formats are supported, including dates, currencies, percentages, text, and others.
-
Freeze Pane Support
To ease the user experience of working with multiple rows and columns, the RadSpreadsheet control for WPF now enables you to pin rows and columns in your worksheet.
-
Named Ranges
Define a name for a cell or range of cells, so you can easily remember and use it throughout your spreadsheet, instead of a cell reference.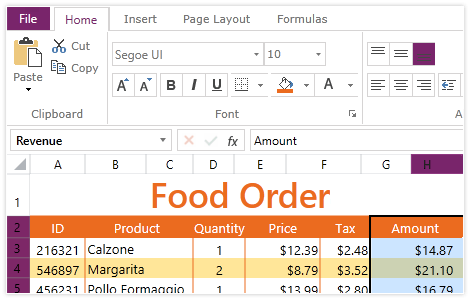
-
Cell Formatting
Provide your end-users the ability to apply different fonts and font sizes, as well as foreground and background color for the text in the cells. This functionality is further enhanced by the ability to use styles and themes for a more consistent look-and-feel in the document. -
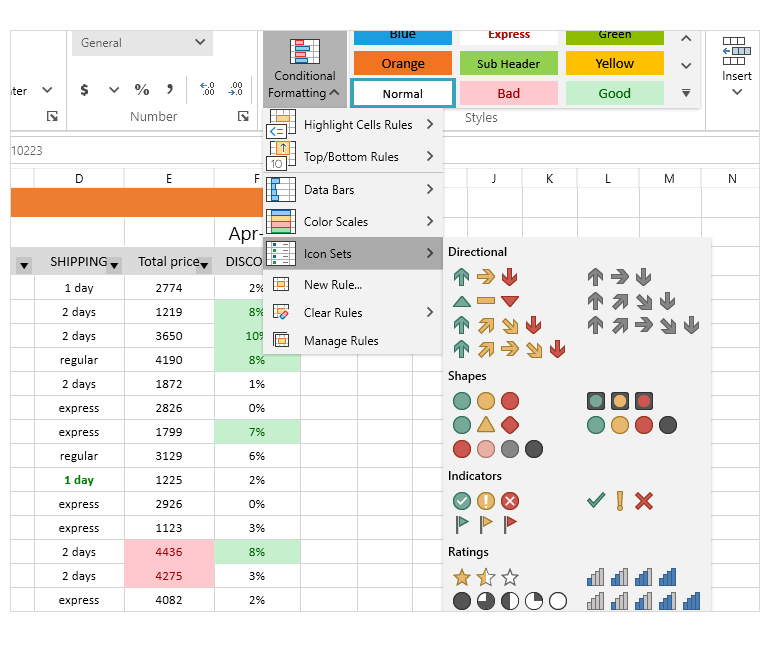
Conditional Formatting UI
Conditional formatting allows users to precisely define the formatting of cells that satisfy predefined conditions, making it easier to analyze data and spot irregularities in it. The feature comes with a wide range of predefined conditions, formatting options and also supports utilizing a formula to define a condition.
-
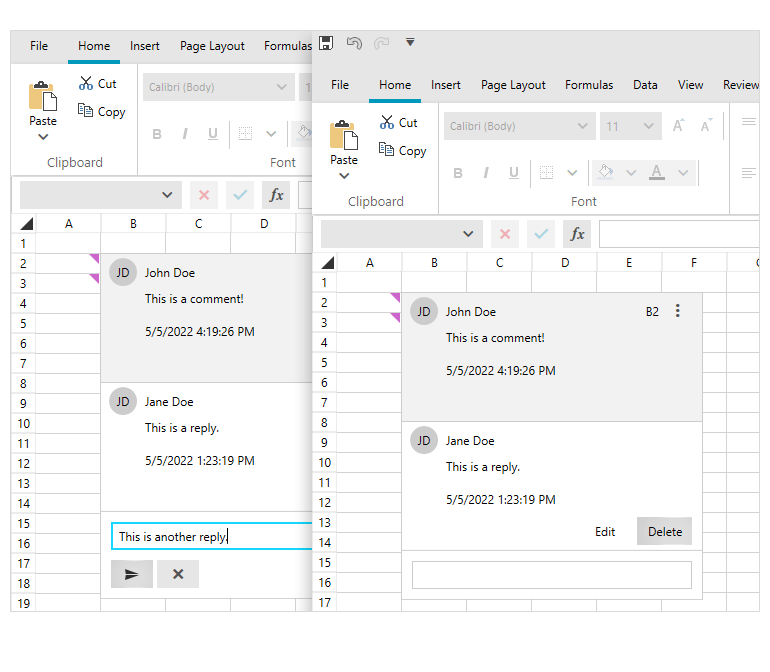
Insert/Delete Comments
This functionality of the Telerik Spreadsheet enables adding a comment to a specific cell. Users can also delete or reply to a comment. Additionally, a comment (thread) can be marked as resolved, deleted or reopened at a later stage.
-
Performance
Enjoy virtually no limitations on the number of cells in a sheet, providing unmatched performance--even with thousands of cells. -
Multiple Sheets and Undo/Redo
Your end-users have the ability to create and use multiple sheets, each one with its own history stack. Separate sheets can be edited at the same time, and every single action can be undone and redone. -
Powerful Ribbon
The SpreadsheetRibbon control compliments Spreadsheet, with convenient ribbon exposing the variety of features the latter supports. With few lines of XAML you get all the UI expected from a standard spreadsheet editing application, including multiple ribbon tabs full of commands, styles gallery, formula and status bar. When updating from version to version, you'll automatically get UI for all the new commands we expose.
The Spreadsheet control provides convenient design-time experience – dragging Spreadsheet in the XAML designer will start code-generation wizard. You can choose a set of components, and all of the needed XAML code and assembly references are automatically added to the project.
-
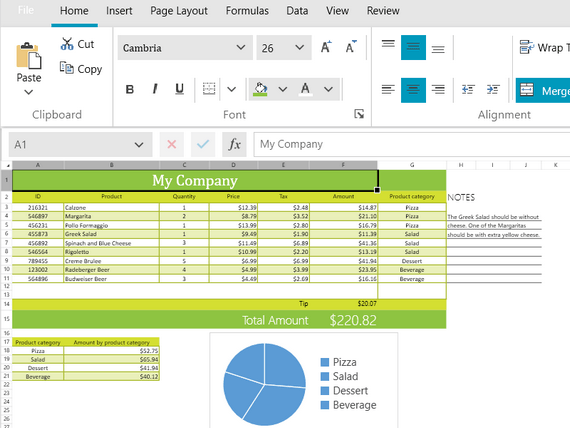
Charts Support
The Spreadsheet component offers support for Charts to better visualize and summarize the data in the spreadsheet document for end users in a visually appealing and understandable way. The functionality offers the ability to not only display charts, but also add and remove chart objects in the spreadsheet itself.
The supported chart types are:
Column
Bar
Line
Pie & Donut
Area
Bubble
Stock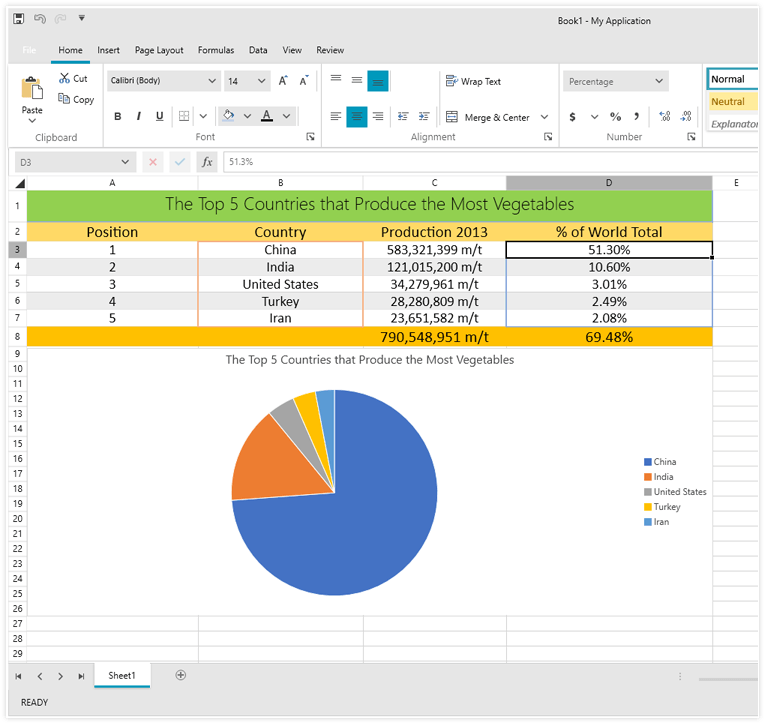
-
Export/Import
Save documents in three different formats to achieve best persistence of the data:
- Excel Microsoft Office Open XML Spreadsheet (.xlsx)
- Comma separated values (.CSV)
- Tab separated values (.txt)
- Portable document format (.pdf) - export only
-
Printing and Print Preview
The new printing feature allows you to insert page breaks, define page areas and choose between numerous printing options. Virtual printers help you easily export your workbooks to different file formats. -
Repeat Specific Rows or Columns on Every Printed Page
You can specify a row or a column that will be repeated on every printed page. You will find this API useful when you need to print or export PDF data spanning on multiple pages and still allow the users to see the important information on the top/left side.
-
New CurrentRegion Selection Command
Empower end users with smarter data manipulation in the Spreadsheet control. A new CurrentRegion property and its corresponding UI command allow users to instantly select a block of adjacent non-empty cells—streamlining tasks like applying formulas, styling ranges, or exporting grouped data with a single click.See the Telerik UI for WPF Documentation: AzureMapProvider.