PivotGrid Overview
A PivotGrid is a powerful tool for displaying and analyzing complex data. It enables users to arrange large volumes of data in a pivot table structure. PivotGrid aggregates (for example, SUM and COUNT) summarize data across different dimensions, offering insights into trends, patterns, and relationships within the dataset.
Key features of the PivotGrid component include the configuration of columns, rows, and measure fields, as well as operations like data filtering and sorting.
Live Demo
Appearance
The PivotGrid component provides built-in styling options that grant visually appealing and flexible rendering experience.
Apart from the default vision of the Telerik and Kendo UI PivotGrid, the component supports alternative styling options which enable you to configure the individual aspects of its appearance.
Anatomy
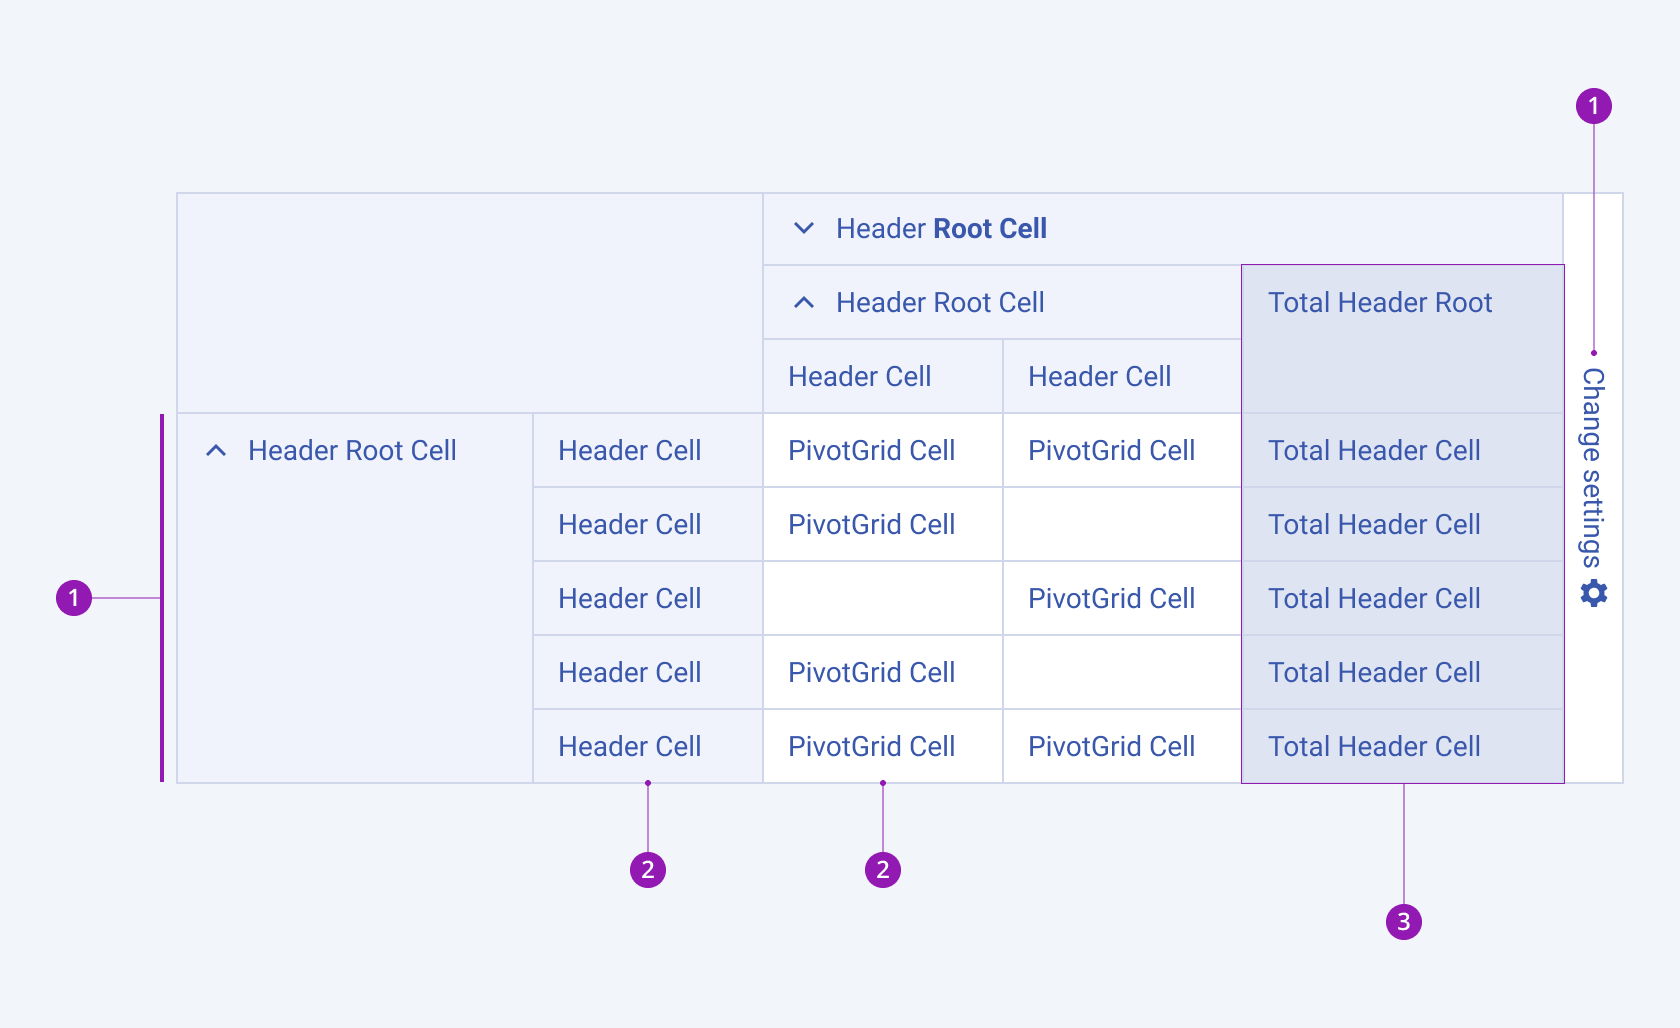
The anatomy of the PivotGrid summarizes the elements of the component.

- Header root cell - Expanded
- Child root cell
- PivotGrid cell
- Total PivotGrid cell
- Configurator button
Configurator
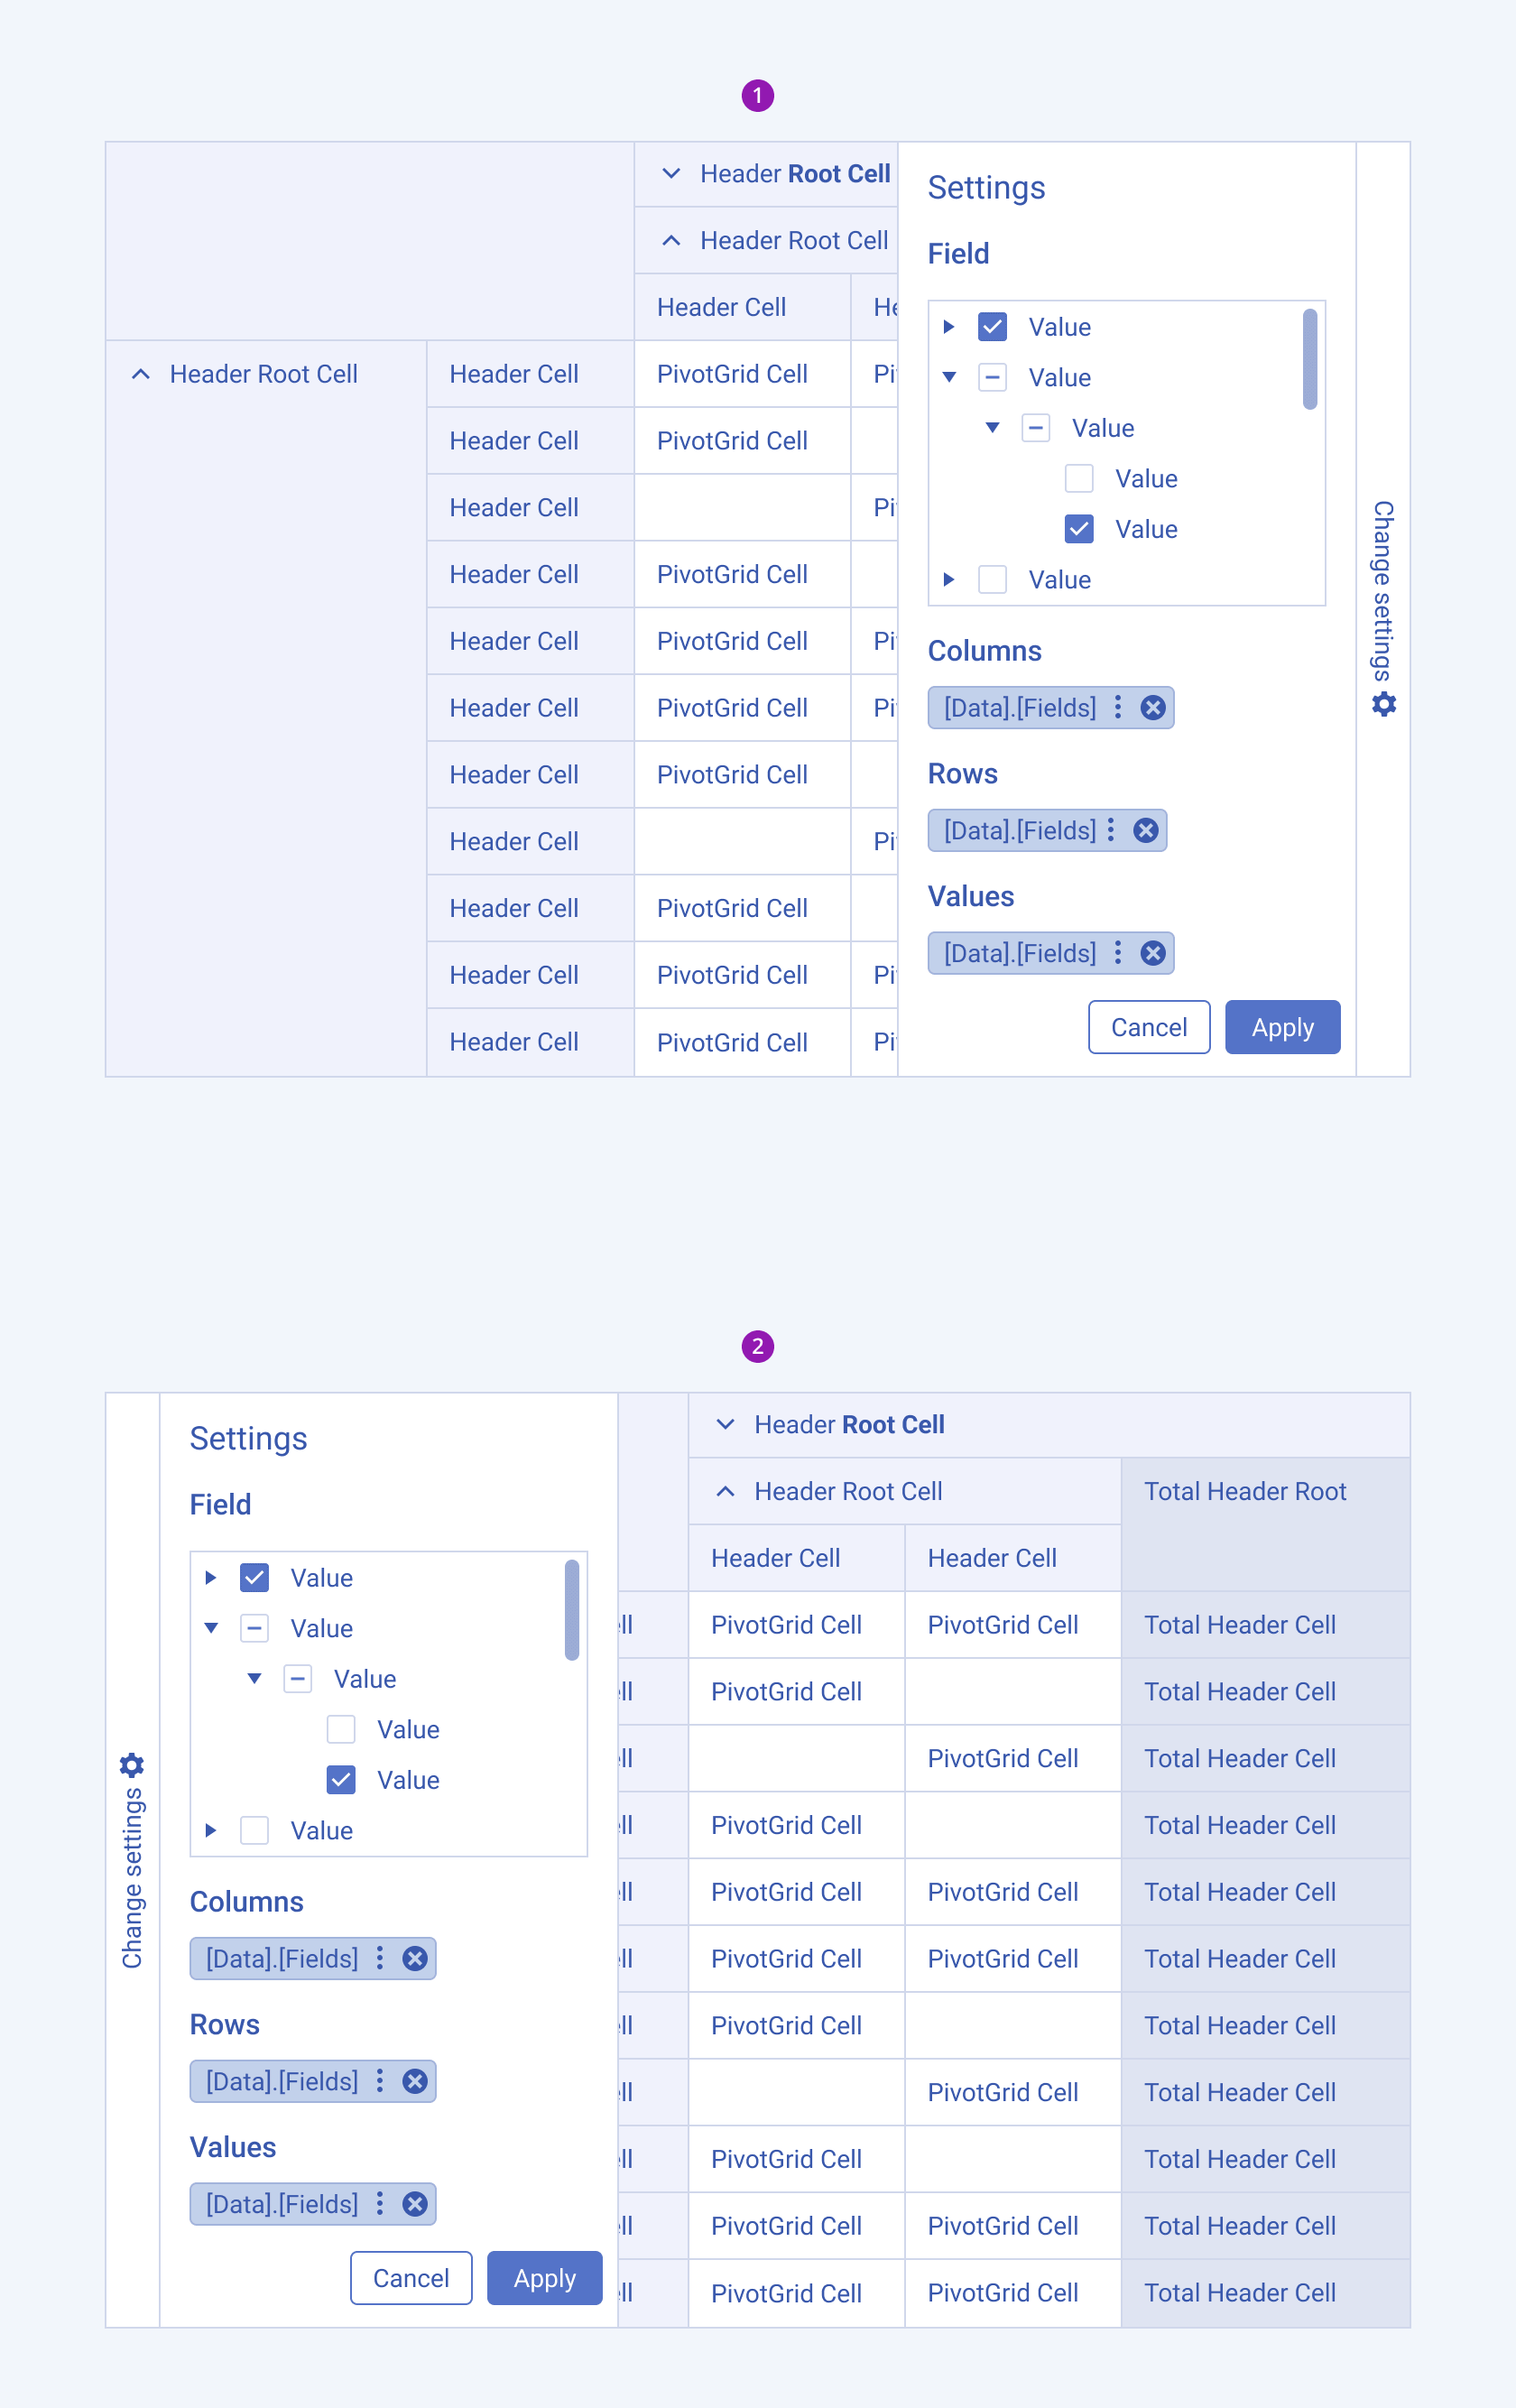
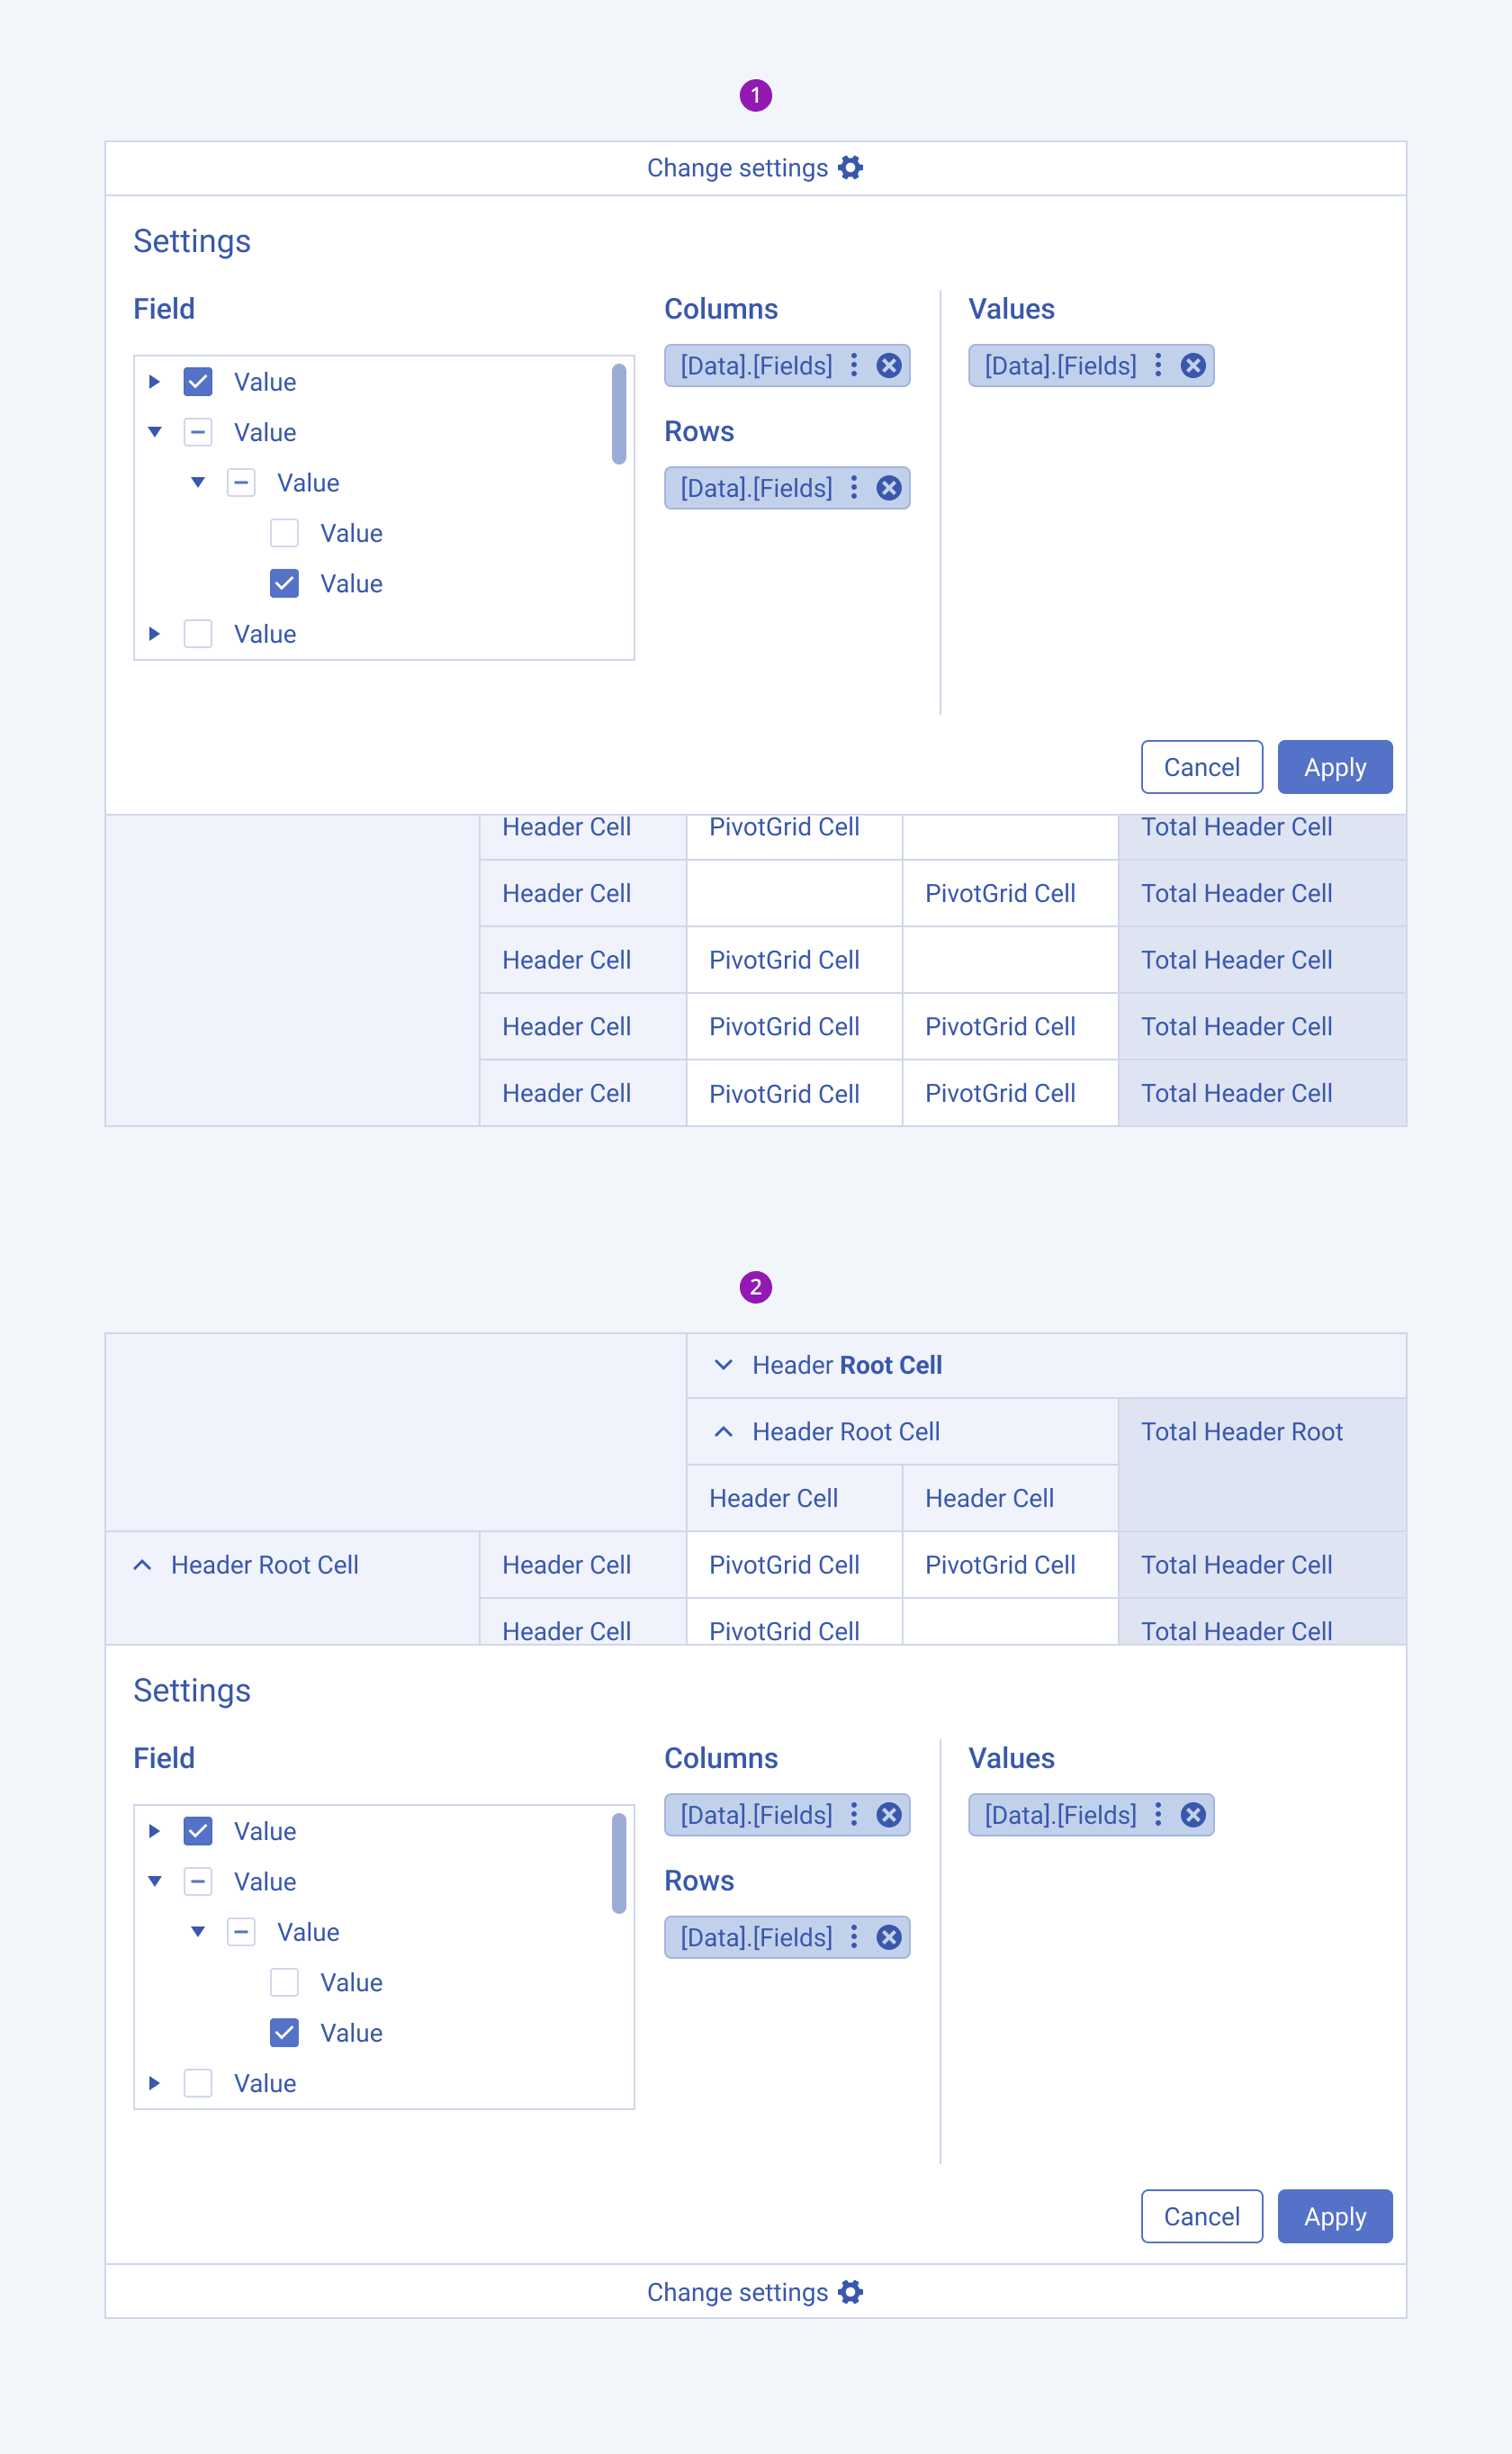
The Change settings button triggers the PivotGrid Configurator. It supports different rendering options depending on the orientation of the Configurator panel.
Vertical Configurator

- Vertical Configurator with right alignment (Default)
- Vertical Configurator with left alignment
Horizontal Configurator

- Horizontal Configurator with top alignment
- Horizontal Configurator with bottom alignment
Sorting and Filtering
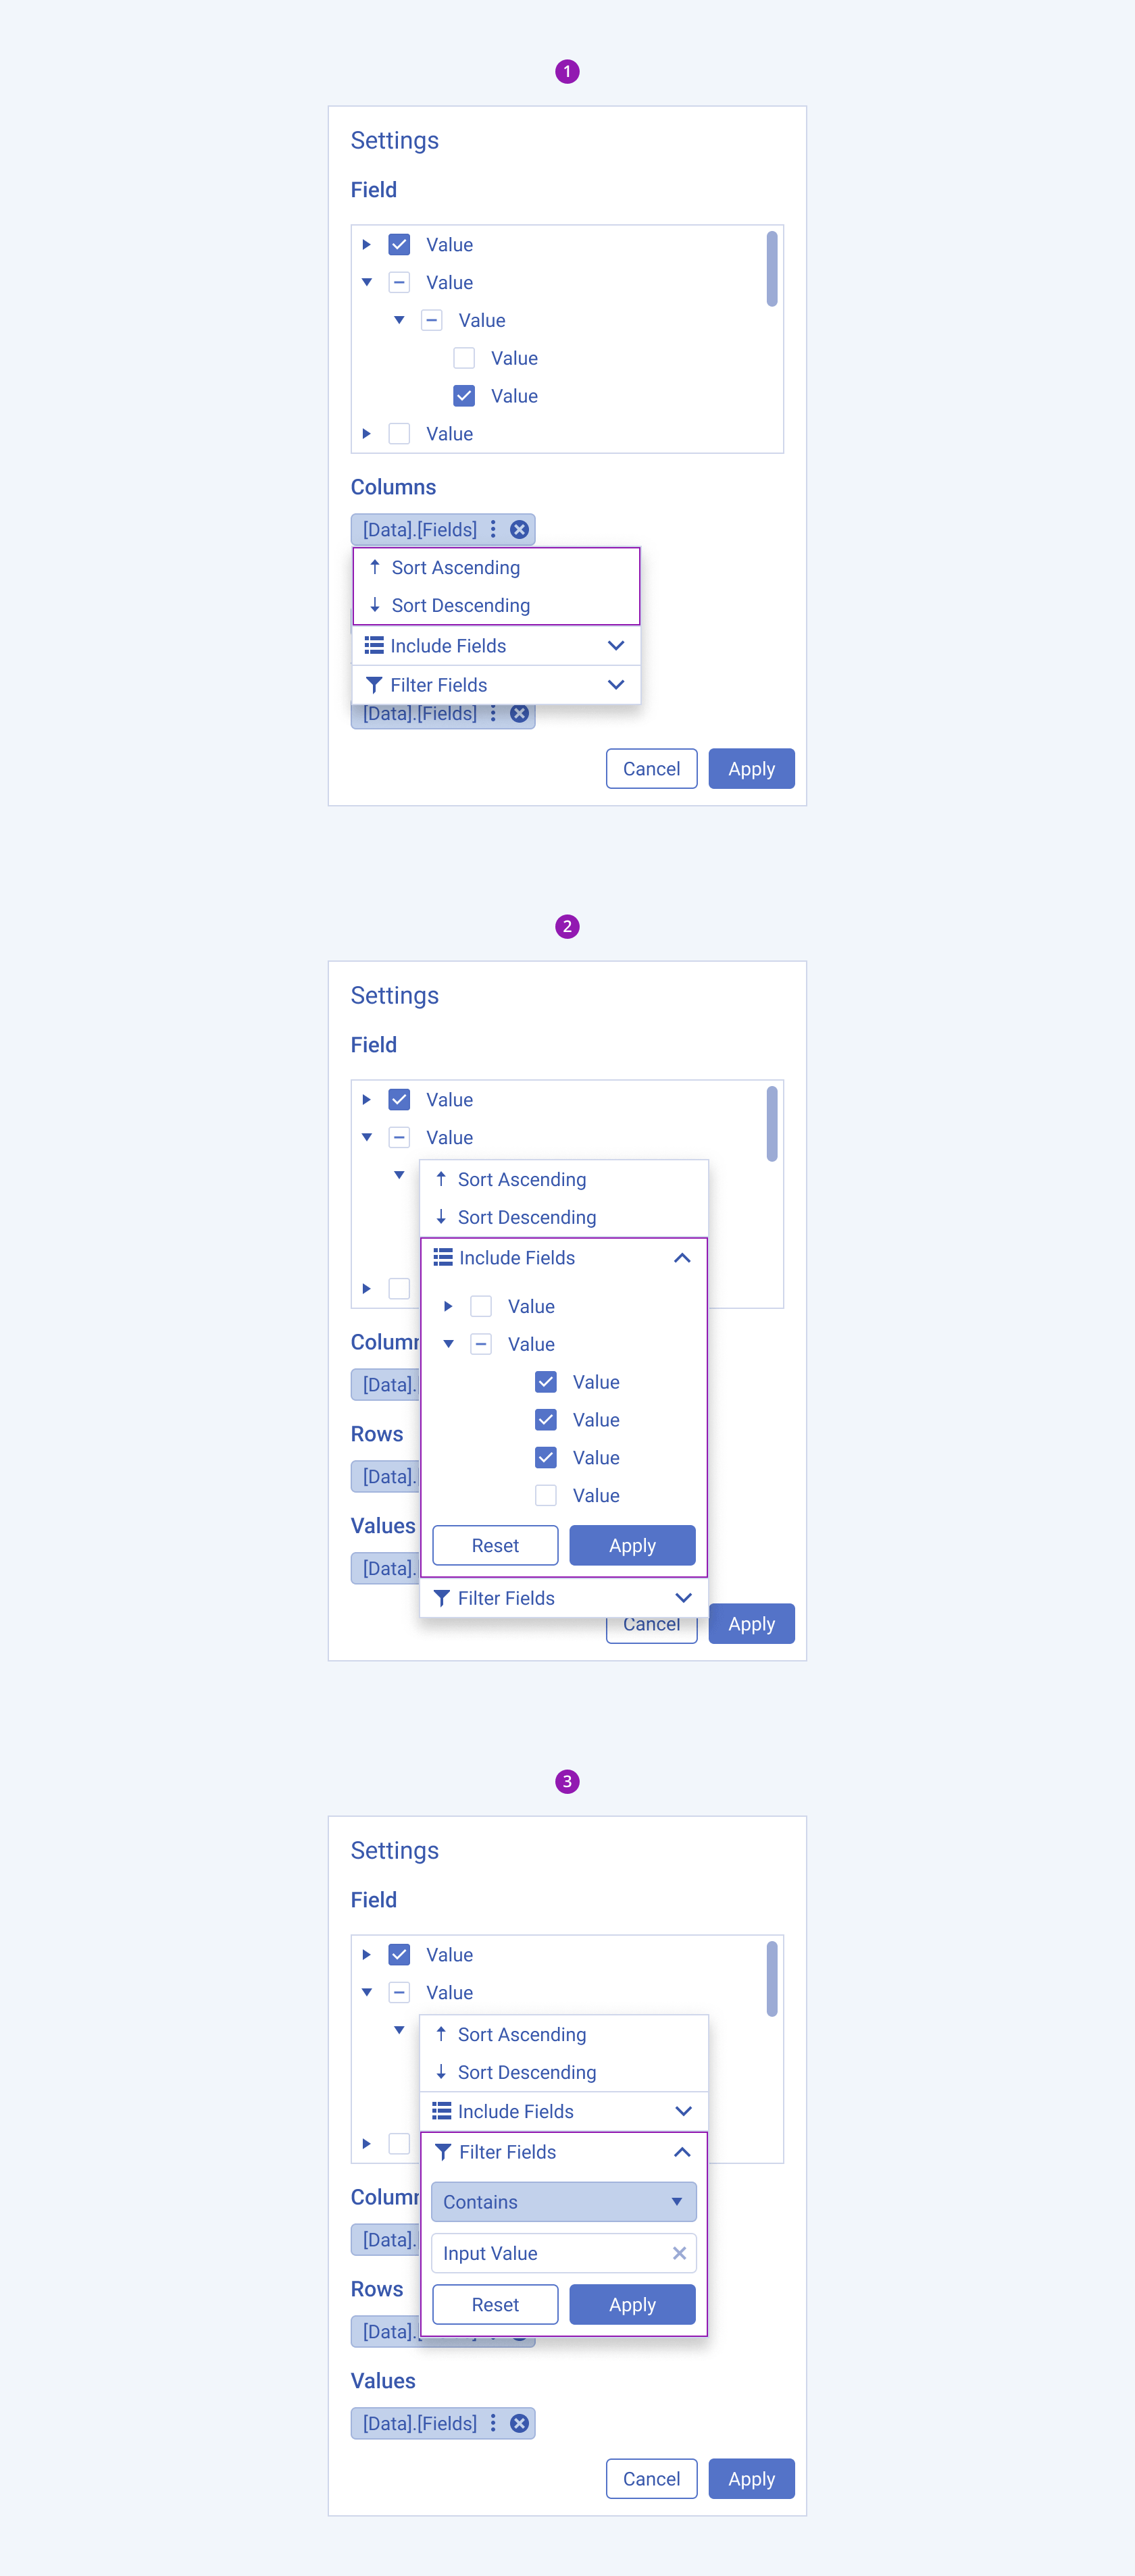
The PivotGrid helps users configure the table's content by using the sorting and filtering options available in the settings panel.

- Sort data
- Include fields
- Filter data
Framework-Specific Documentation
For specific information about the component, refer to its official product documentation:


