Gantt Overview
The Gantt component is a powerful tool that provides a comprehensive and organized view of project schedules. With its TreeList and Timeline sections, users can easily track project start and finish dates, task progress, dependencies, and milestones. Its rows and columns layout makes it simple for users to view and edit data, while its sorting and filtering features enable efficient management of project timelines and resources. Gantt charts are the ideal choice for project management as they ensure seamless coordination across tasks and teams.
Live Demo
Anatomy
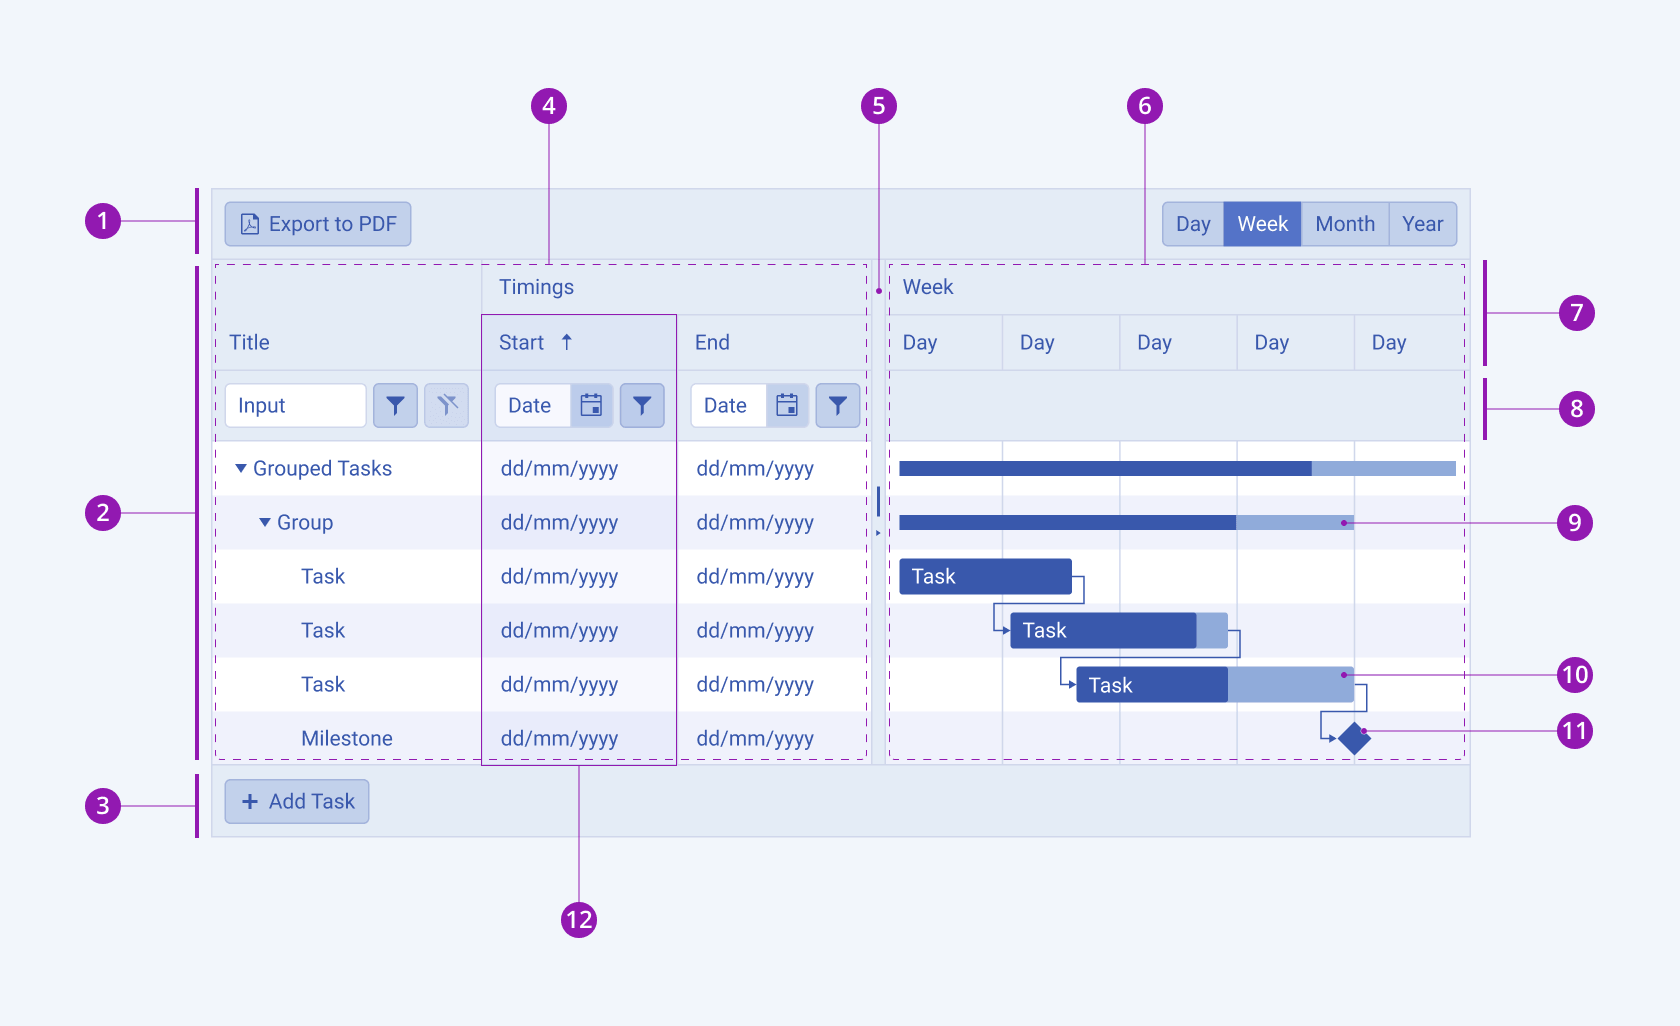
The anatomy of the Gantt summarizes the elements of the component:

- Header toolbar
- Gantt
- Footer toolbar
- Treelist pane
- Splitbar
- Timeline pane
- Multicolumn grid header
- Filter row
- Summary task
- Regular task
- Milestone task
- Sorted column
Framework-Specific Documentation
For specific information about the component, refer to its official product documentation:


