
UI for WPF
WPF PivotGrid
- The Telerik PivotGrid allows you to aggregate millions of records in a concise tabular format and easily group, filter, sort and manipulate that data to create different reports.
- Part of the Telerik UI for WPF library along with 160+ professionally-designed UI controls.
- Includes support, documentation, demos, virtual classrooms, Visual Studio Extensions and more!
-
Summarize Large Datasets in Readable Way
The Telerik Pivot Grid for WPF is a control used to aggregate millions of records in a concise tabular format. The data can be easily grouped, filtered, sorted and manipulated to create different reports.
Documentation on Getting Started with the Telerik Pivot Grid for WPF -
Sorting and Filtering
PivotGrid allows you to apply sorting on your rows and columns. Naturally, the sorting can be ascending or descending, but in addition to that, PivotGrid gives you the ability to sort based on totals. You can also apply different filters to hide/show specific groups or use one of the three filter types: Label filter (filters data by header name), Value filter (filters data by aggregated values), Top 10 filter (filters by aggregated values, but shows only top/bottom results).
Check out the product demos to see the powerful sorting and filtering capabilities of the Telerik Pivot Grid for WPF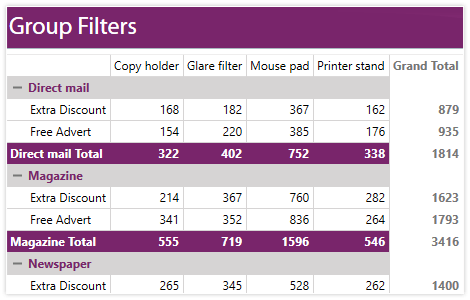
-
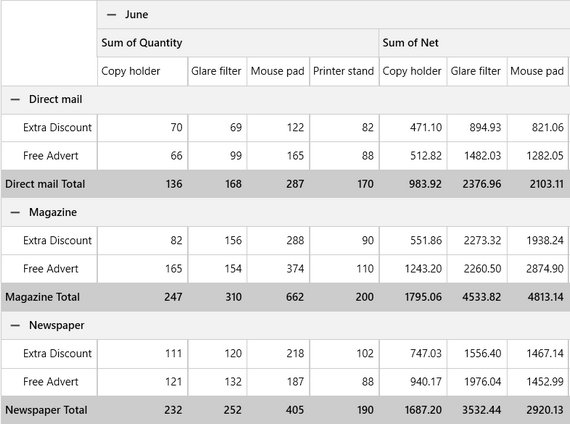
Grouping
Group records in an assigned data source according to row and column descriptors, based on the selected fields in row and column areas. Apply sorting on your rows and columns, as well as different filters to hide/show specific groups.
Visit the product documentation for more info on working with the Telerik Pivot Grid for WPF
-
Editing capabilities
The PivotGrid component can be extended to allow UI editing of the cells values, which in turn will raise a notification that allows for data recalculation. This is useful in cases where you want to test how different input will translate to.
Visit the documentation for more info on editing with the Telerik Pivot Grid for WPF
-
Layouts and Totals Position
PivotGrid supports all of the three most widely used report layouts: Tabular, Outline and Compact. You can set each of them on your rows and your columns, and in this way achieve nine different views of PivotGrid. And if this is not enough, you can also rearrange where the row/column totals positioning is located from the top, bottom, right, left or none.
Visit the product documentation for more info on layouts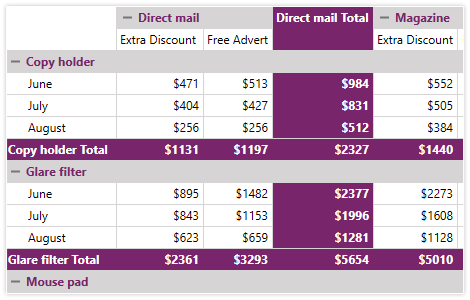
-
Aggregate Functions
Enjoy several predefined aggregate functions that you can use for your data. Choose between sum, average, count, max, min, or something more complicated like standard deviation, variance or product. All of this is done in the easiest possible manner – just one line of code or a couple of clicks with PivotFieldList.
Check out the product demos to see the Pivot Grid in action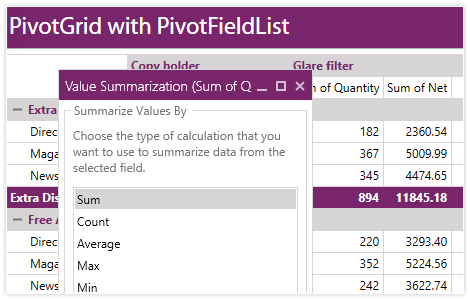
-
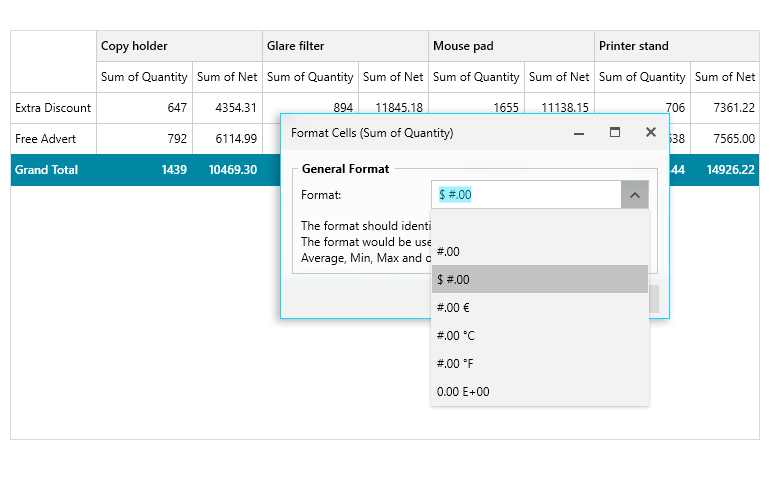
Apply Number Format to Count Aggregation Values
Now it is possible to format the Count aggregation values through the PivotGrid component UI, out of the box. A Number Format dialog of a particular Count aggregate now allows inserting a specific format. For example, this can be useful when you want to better format values with thousands.
-
Calculations
Use calculations to further analyze the aggregated data by comparing the cells to each other. For example, for each cell you can: compute the percentage of the GrandTotal, compute the difference from its previous or next one, calculate its weighted average, etc., and help you discover its relative importance.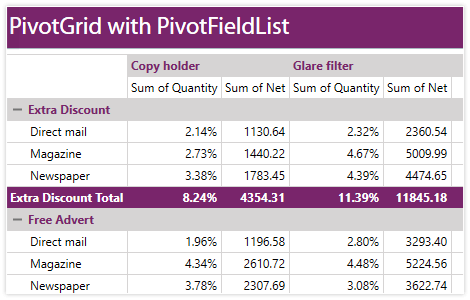
-
Ragged Hierarchy Support
RadPivotGrid provides yet another option for easy data summarization and visualization. Use the Ragged Hierarchy support for RadPivotGrid to represent user-defined hierarchies with an uneven number of levels.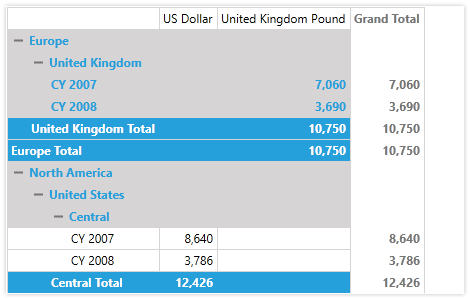
-
Hierarchy Support with LocalDataSourceProvider
The Telerik UI for WPF PivotGrid control supports hierarchies when used with the LocalDataSourceProvider. This allows you to organize and analyze your data in a hierarchical structure.
-
Support for KPIs
PivotGrid supports KPIs, so you can use the ones defined on the server and easily measure performance.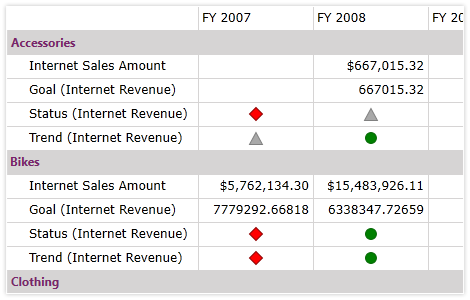
-
OLAP Support
PivotGrid makes access to OLAP cubes easy. You can choose between our XmlaDataProvider and AdomdDataProvider depending on your server connection needs. In combination with PivotFieldList you can easily visualize data from your Cube. You can also apply filters or sort the data to view only the items you need.
Visit the product documentation for more info on OLAP support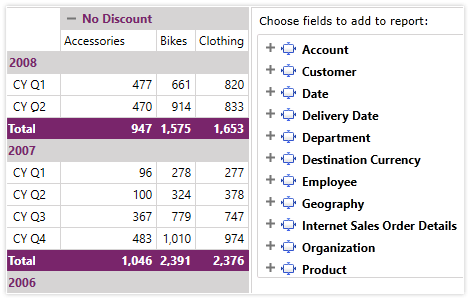
-
Load Data from OLAP Cube On Demand (Lazy Loading)
If you want to bind a UI for WPF PivotGrid to an OLAP Cube, you don’t have to worry about performance thanks to the load on demand (lazy loading) feature.
-
Tooltips
PivotGrid shows ToolTips for each cell. Just move the mouse over a cell, and you will see information about its value and associated aggregate, row, and column. You can also set your own ToolTips or simply disable them.
Visit the product documentation for more info on tooltips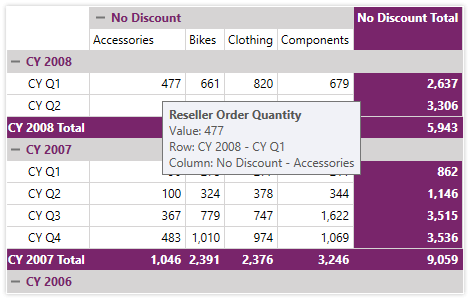
-
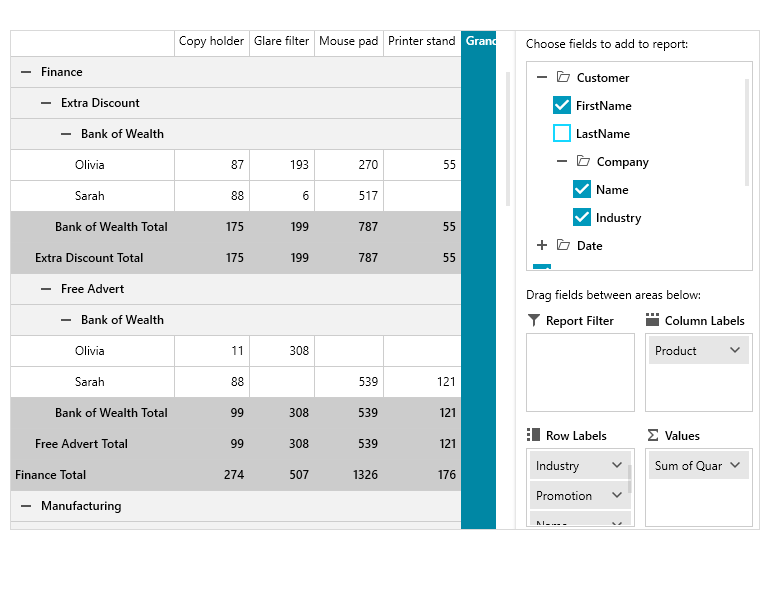
PivotFieldList
Use PivotFieldList to provide your users an easy runtime customization of the PivotGrid reports. You can easily add fields to the report, or drag fields between different areas. You can use integrated dialogs to modify each aspect of PivotGrid.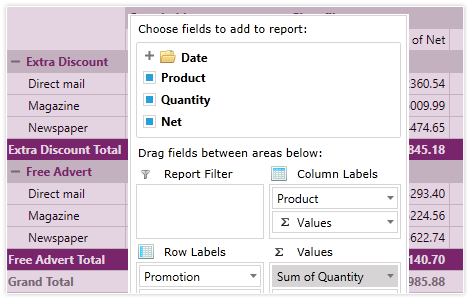
-
Inline PivotFieldList
The WPF Pivot Grid component now allows data visualization, hiding and aggregating of different fields without an explicitly defined Pivot Field List. This is now possible thanks to the Field Chooser dialog.
Visit the product documentation for more info on Inline PivotFieldList
