
UI for WPF
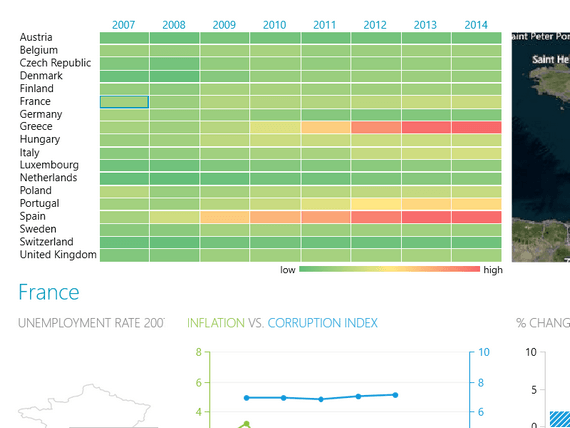
WPF HeatMap
- Display values in indicative colors in a two-dimensional way with the Telerik HeatMap for WPF. Utilize the various built-in features such as tooltip, labels, row and column header customizations, colorizers and more.
- Part of the Telerik UI for WPF library along with 160+ professionally-designed UI controls.
- Includes support, documentation, demos, virtual classrooms, Visual Studio Extensions and more!
-
Interactive Tooltips
Enjoy interactive tool-tips, which provide the user with context aware detail that doesn’t complicate the summary.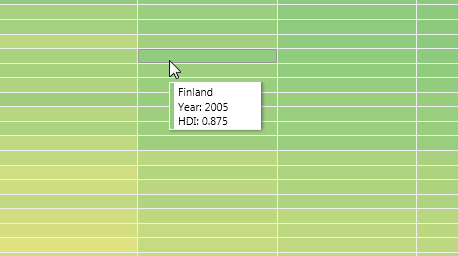
-
Colorizers
Two different out-of-the-box colorizers (similar to the ones you can find in our TreeMap control) make it easy to use color to encode values.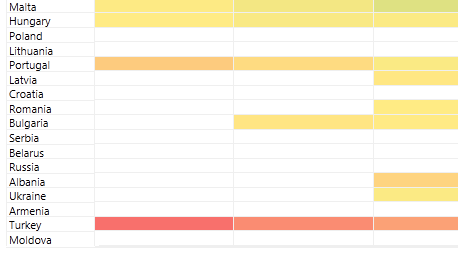
-
Two Approaches to Data
The control features a Categorical and Horizontal/Vertical data-definition API, which enables you to map your data attributes directly or generate groups automatically for all unique values. The API is optimized for maximum simplicity without compromising functionality. -
Fast Rendering
The control uses immediate-mode bitmap-based rendering with our own proprietary hit-testing and lay-outing, which enables it to render an obscene amount of visual detail without slowing down and without sacrificing interactivity.
