
Kendo UI for jQuery
jQuery Diagram
- Create rich diagrams with the Kendo UI for jQuery Diagram component.
- Part of the Kendo UI for jQuery library along with 120+ professionally-designed components.
- Includes support, documentation, demos, virtual classrooms, learning resources and more!
-
Layouts
Choose from three built-in layouts when designing your jQuery Diagram:
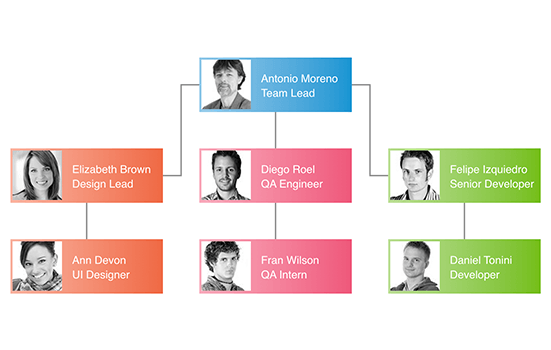
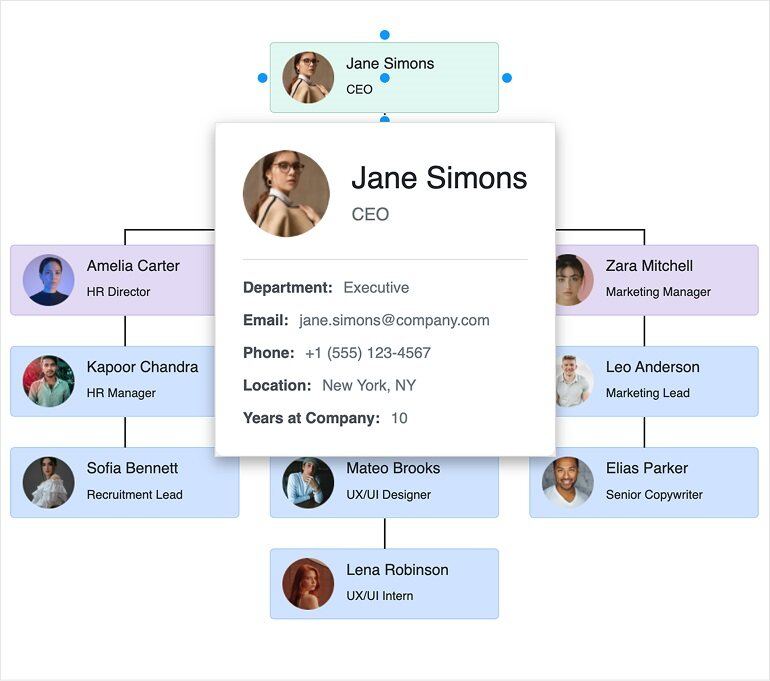
1. Tree Down—organizes data in a hierarchical structure (classic org chart)
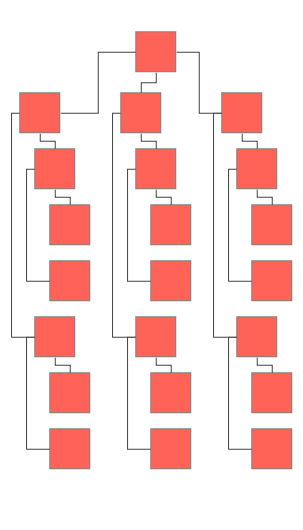
2. Tree Up—illustrates a force-directed layout algorithm
3. Tipover Tree—layered graph layout (could serve as a decision-making flowchart)
-
Shapes
You can add various shapes to the jQuery Diagram component to personalize its look. Use rectangles, circles or any other shape you prefer and further customize the component by changing the background of the shapes to match the style of your application.
-
Editing
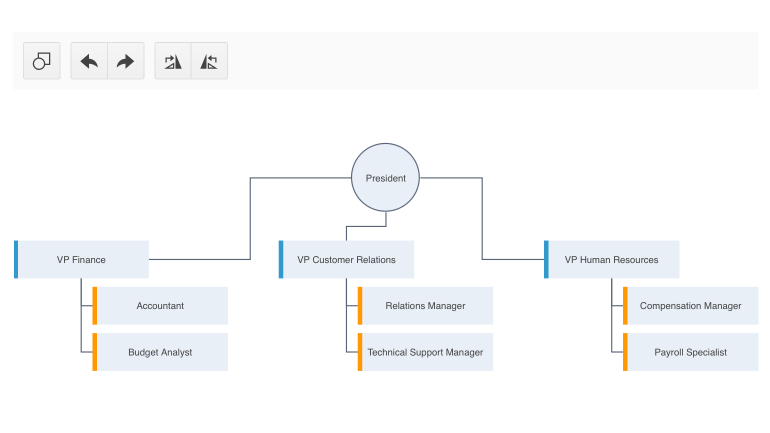
Allow your users to edit their diagrams by giving them a toolbar with functions such as Rotate, Edit Text, Change Color, Undo, and Redo.
-
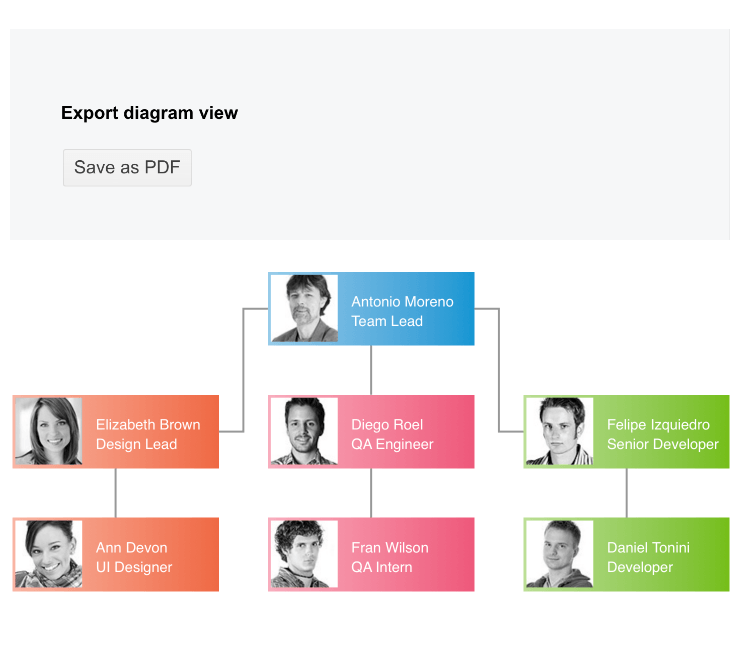
Export to PDF, Image, SVG
Export the Diagram you have created to a PDF, PNG Image or and SVG file, directly from the browser. Customize its look to match the user’s requirements.
-
Design and visualize processes in the browser
The Kendo UI for jQuery Diagram component helps you build interactive diagrams that map processes, hierarchies and networks. Users can create nodes and connections, auto-arrange content with presets and export results for sharing. The component exposes a rich API, events and MVVM support to fit enterprise-grade apps.
-
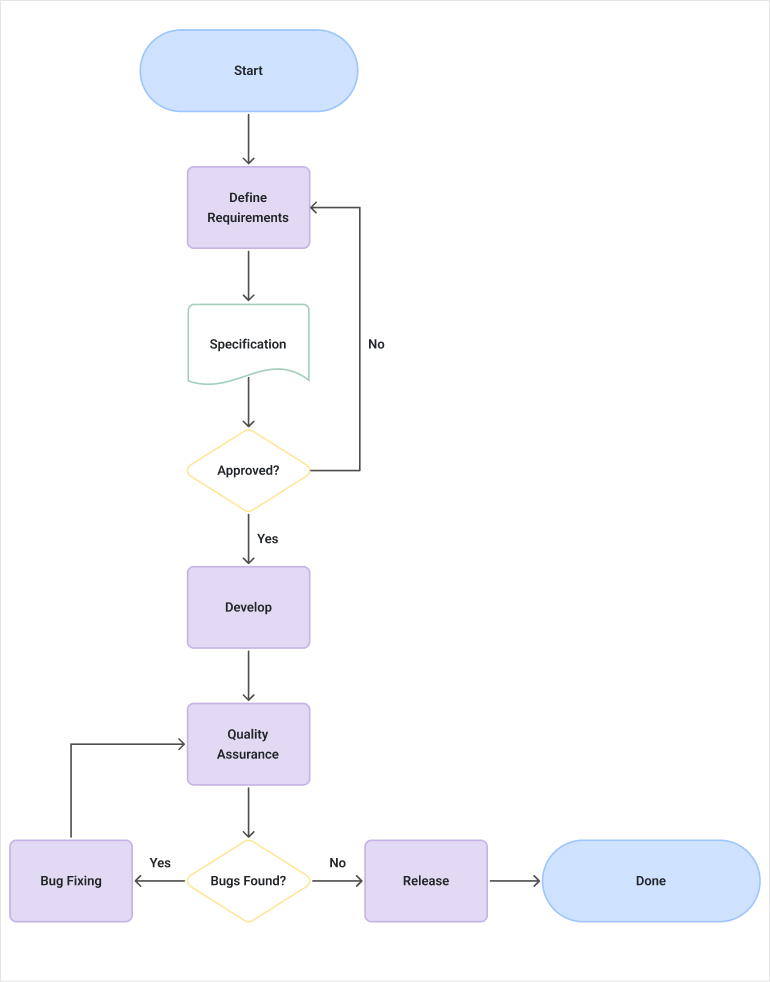
Workflow shapes that make sense
Use common workflow shapes such as Terminator, Process, Decision, Document, PredefinedProcess, Database, Delay and ManualOperation to represent each step accurately. Shapes are easy to configure with size, color and typography so flows are both consistent and readable.
-
Workflow Diagram Starter
Jump-start common scenarios with a ready-made workflow example that combines shapes, connections and layout options. Use it as a reference for building your own flowcharts and process maps with consistent styling.
See the jQuery Diagram workflow diagram demo.
-
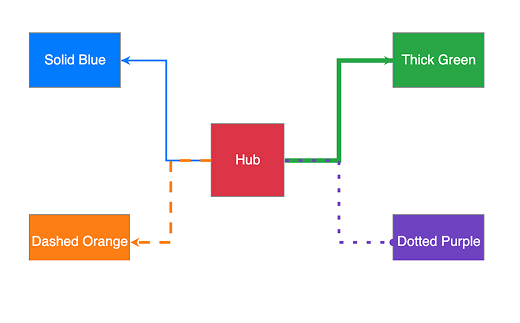
Connections
The Kendo UI for jQuery Diagram connections allow you to define and customize links between shapes, including their routing, appearance, and behavior. This provides greater control over how relationships between diagram elements are visualized and managed.
-
Tooltips
The Kendo UI for jQuery Diagram tooltips can be configured for diagram shapes and connections, enabling contextual information to be displayed on hover for improved usability and clarity.
-
Keyboard Navigation
The jQuery Diagram supports keyboard navigation, allowing users to interact with the diagram elements using standard keyboard shortcuts for better accessibility.
