Kendo UI for jQuery
jQuery CircularGauge
- Represent data as a line on a circular scale to compare date values such as progress towards goal.
- Part of the Kendo UI for jQuery library along with 120+ professionally-designed components.
- Includes support, documentation, demos, virtual classrooms, learning resources and more!
-
Overview
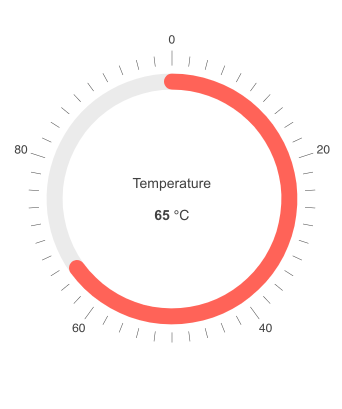
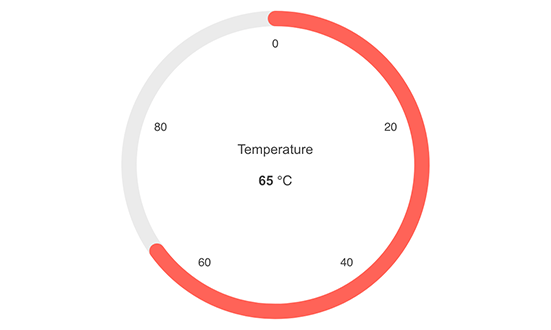
The Kendo UI for jQuery Circular Gauge is a data visualization tool that enables you to display values on a full circular scale. Colored outlines along the scale represent the value. The gauge can animate the value indicator and allows you to customize the colors and scale ranges through configuration options.
-
Color Ranges
In many scenarios, assigning different colors to values gives the visualization even more meaning. Green for good, yellow for caution, and red for bad is a very common example. The Circular Gauge allows you to change the color according to value.
-
Export to PDF, Image, SVG
Thanks to the built-in integration with the Kendo UI for jQuery Drawing library, you can export the Circular Gauge as a PDF file, an SVG file or as an image.
-
Scale Options
Make the Gauge show exactly what your users need. Visual properties including the colors of the labels and ticks, whether labels and ticks are displayed at all or whether the Gauge’s value moves clockwise or counterclockwise can easily be modified.