
Kendo UI for jQuery
jQuery ArcGauge
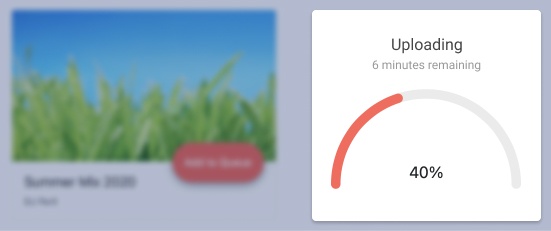
- Represent data as a line on a arc shape to compare date values such as progress towards goal.
- Part of the Kendo UI for jQuery library along with 120+ professionally-designed components.
- Includes support, documentation, demos, virtual classrooms, learning resources and more!
-
Overview
The Kendo UI for jQuery Arc Gauge is a data visualization tool that enables you to display values on a arc shape. Colored outlines along the scale represent the value. The gauge can animate the value indicator and allows you to customize the colors and scale ranges through configuration options.

-
Color Ranges
In many scenarios, assigning different colors to values gives the visualization even more meaning. Green for good, yellow for caution, and red for bad is a very common example. The Arc Gauge allows you to change the color according to value.

-
Export to PDF, Image, SVG
Thanks to the built-in integration with the Kendo UI for jQuery Drawing library, you can export the Arc Gauge as a PDF file, an SVG file or as an image.
-
Scale Options
Make the Gauge show exactly what your users need. Visual properties include center template, colors, opacity, theme, and much more.
