UI for ASP.NET MVC
ASP.NET MVC HeatMap
- Use the Telerik UI for ASP.NET MVC HeatMap component to display values in indicative colors in a two-dimensional way. Utilize the various built-in features such as tooltip, crosshairs, PDF export, color scales and more.
- Part of the Telerik UI for ASP.NET MVC library along with 120+ professionally designed UI components.
- Includes support, documentation, demos, virtual classrooms and more!
-
Overview
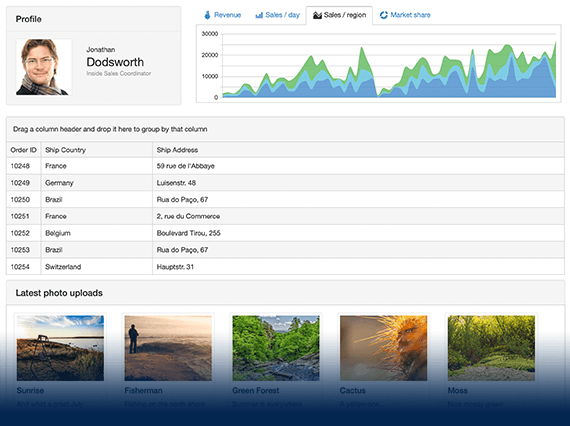
Display multiple data values on a color-indicated, two-dimensional chart with the Telerik UI for ASP.NET MVC HeatMap component. It can serve you in many cases to effectively visualize and compare values measured often, even on a daily basis, like temperatures, sales, orders, etc. The control comes with built-in tooltips, color scales, crosshairs, panning and zooming, category binding, PDF export and more.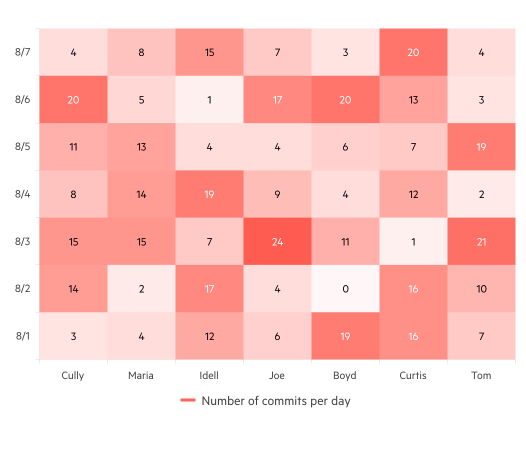
-
HeatMap Shapes
The Telerik UI for ASP.NET MVC HeatMap Chart comes with various options you can choose from when visualizing a segment. You can present the data values as circles, rectangles, rounded rectangles, triangles or add a custom shape.
Explore all HeatMap Shapes in this demo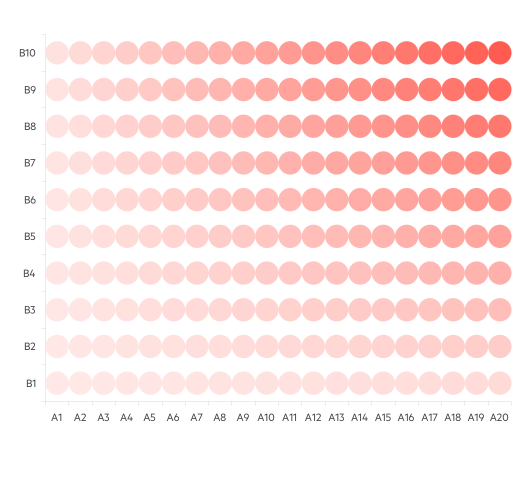
-
Color Scales
The HeatMap uses color to visualize different values on the Chart. The color changes its density depending on the value it is illustrating. It can vary from white for the smallest values to a completely filled-in color for the largest values. This helps present data in a clearer way and allows users to quickly spot the lowest and highest data points.
Check out the ASP.NET MVC HeatMap Chart Color Scheme -
Tooltip
It can be overwhelming to try and focus on one value among hundreds. That is why the HeatMap chart has a built-in tooltip feature. It lets users hover over a value and see more information about it. The color of the tooltip changes along with the color of the value in focus.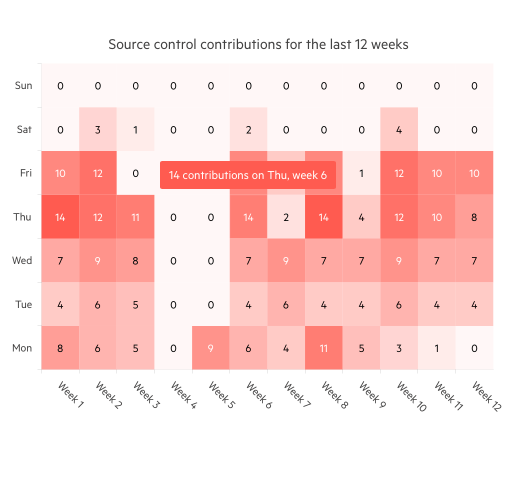
-
Crosshairs
In the ASP.NET MVC HeatMap component, crosshairs are a pair of lines that intersect at the current position of the user’s mouse cursor. They are used to provide a visual cue for the user to focus on a single value and read more about it in the tool tip. -
Export to PDF
As with every chart, the HeatMap component is used for data visualization which will be further analyzed to provide valuable insights to the users. The HeatMap chart can be easily exported to a PDF file with the click of a button and included in presentations and reports. -
Theming
The ASP.NET HeatMap Chart is part of the Telerik UI for ASP.NET MVC suite, which comes with multiple built-in themes and swatches you can choose from. Explore the Default (our own styling), Material (based on the Material Design guidelines), Bootstrap (for seamless integration with Bootstrap) and Fluent (based on Microsoft Fluent UI) themes and choose the swatch that best meets your design requirements.
If neither of the available themes and swatches satisfies your needs, you can easily customize them with a few lines of CSS or create new themes by using the Progress SASS ThemeBuilder application.