
UI for WinForms
WinForms Sparkline
- The WinForms Sparkline is lightweight chart that presents key information with excellent performance.
- Part of the Telerik UI for WinForms library along with 165+ professionally-designed UI controls.
- Includes support, documentation, demos, virtual classrooms, Visual Studio Extensions and more!

-
Presents Key Chart Information with Excellent Performance
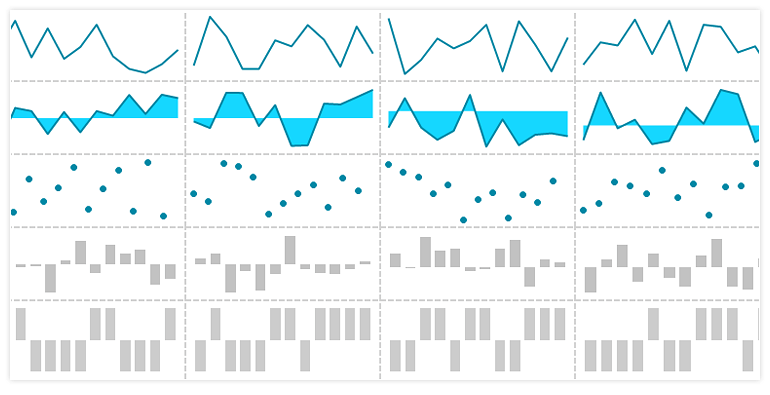
The WinForms Sparkline control is a compact, yet powerful way to display visual representation of data in Windows Forms applications. Enable application users to easily grasp a trend of some measurement temperature or stock price move.
-
Null Values Support
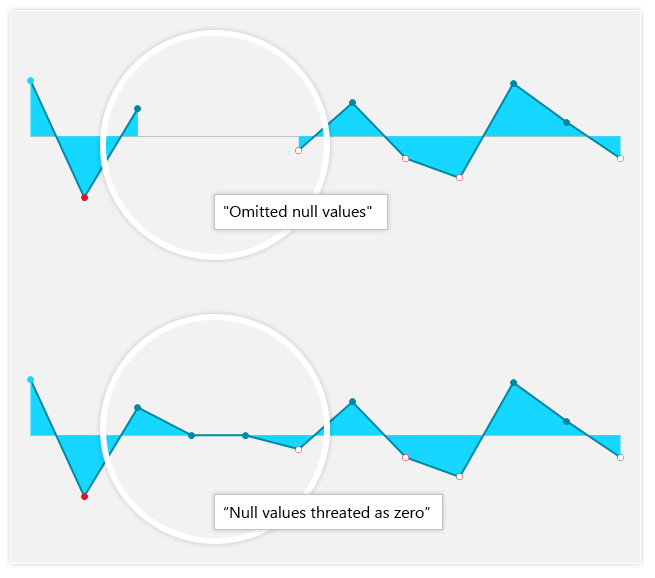
Handling null values from the data source is always two-fold – there are cases where it would make sense to show these as gaps in the data visualization, while in other cases we need to treat them as zero. Both of these are possible with the EmptyPointBehavior of the Sparkline component.
-
Appearance and Customization
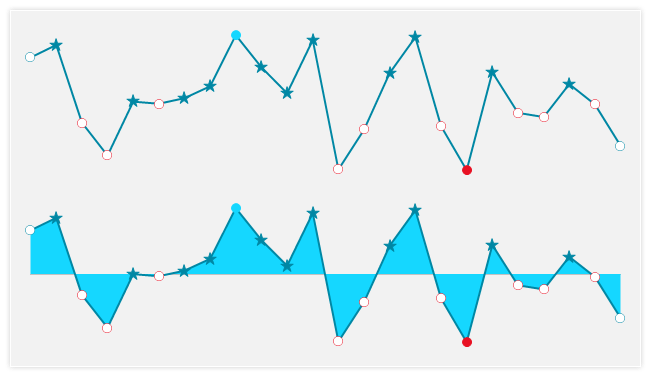
All of the control parts can be customized with the provided API extension points, so any scenarios can be achieved. Here is an example where pins and data points are being drawn on the Sparkline:
-
Extensive Visual Studio Design Time Support
Telerik Sparkline provides rich design time support, making customizations and configurations very Some key capabilities include:
- Apply themes in design time and easily switch between them; the ThemeName property in the Smart tag automatically detects the present themes
- Options to search the forums or open online documentation are also available in the Smart Tag
-
Themes
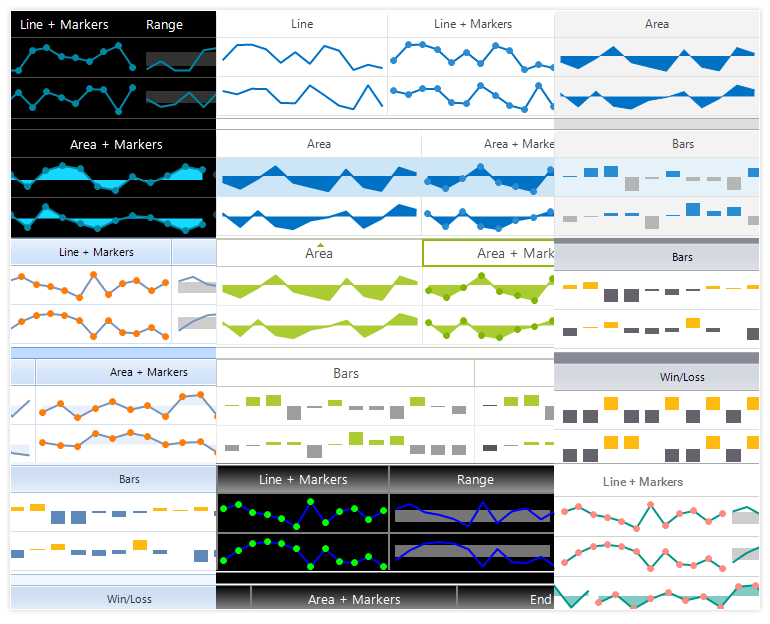
The control is shipped with a rich set of themes that allow you to easily build slick interfaces with the look and feel of some of the latest Windows and Office versions. The themes can be easily switched using a single property.
The Telerik Presentation Framework also features support for custom themes, which can be built from scratch to fit your exact visual demands by using the Visual Style Builder productivity tool.
-
Sparkline Usage
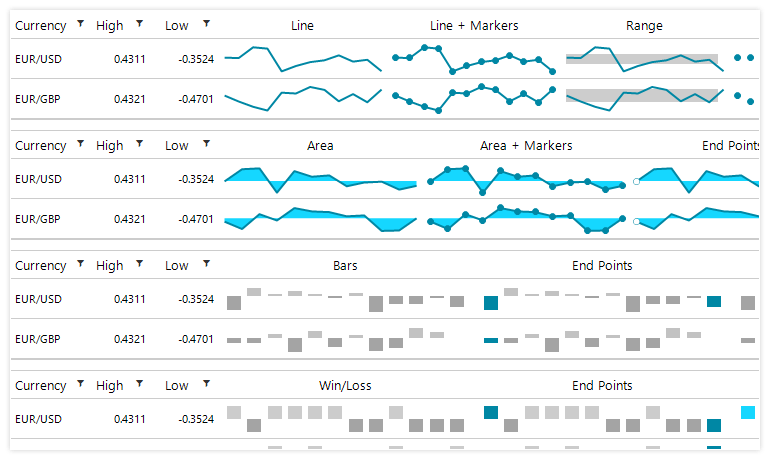
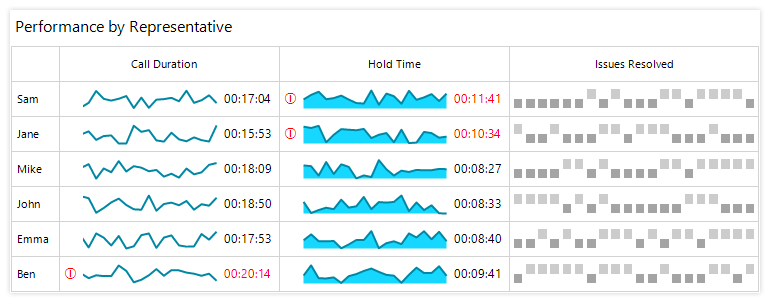
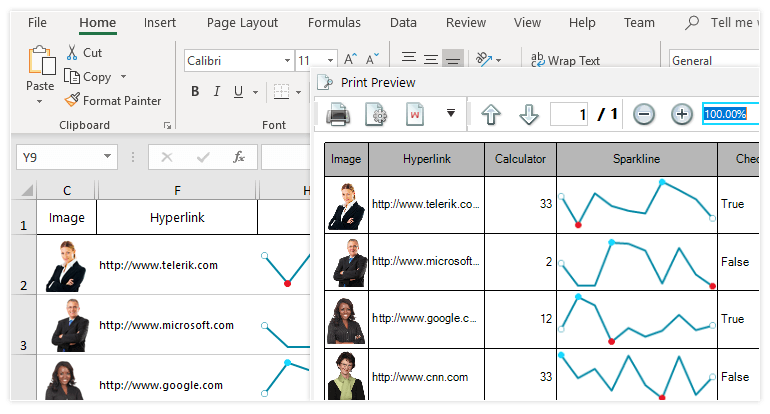
The WinForms Sparkline control can be used standalone as well as in the context of RadGridView by using the dedicated Sparkline column. In addition, thanks to the powerful Telerik Presentation Framework, the Sparkline element can be used in conjunction with any other control from the Telerik UI for WinForms suite.
-
Data Binding
The control can be bound to any type of data source that inherits from IList, IListSource (such as DataTable or DataSet), IBindingList (such as BindingList) or IBindingListView (such as BindingSource), making it to setup. In addition, there is the possibility to manually populate the series and its data
-
Sparkline Indicators
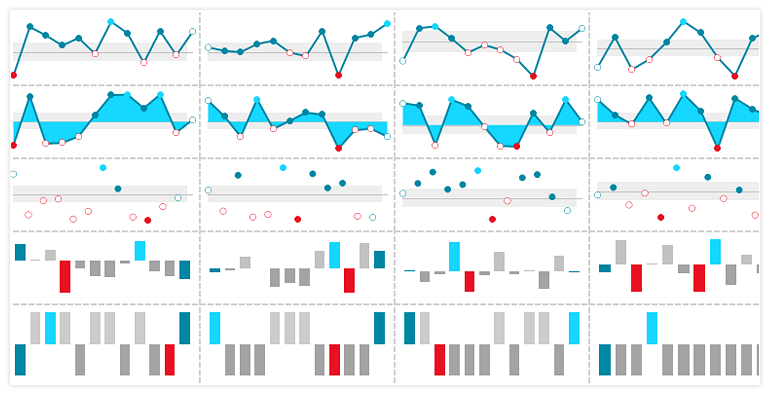
Sparkline indicators are a great way to point the user’s attention to a certain part of a trend such as highlighting high and low points, negative points or the first and the last points. All of these come out-of- the-box with the Telerik UI for WinForms Sparkline control. In addition, there is also an extensibility point where custom indicators can be created.
-
Series Types
Sparklines show trends in a series of values, such as seasonal increases or decreases, economic cycles, or to highlight maximum and minimum values. This can be achieved by using its Area, Bar (Column), Line, Scatter and Win/Loss series.
-
Sparkline Annotations
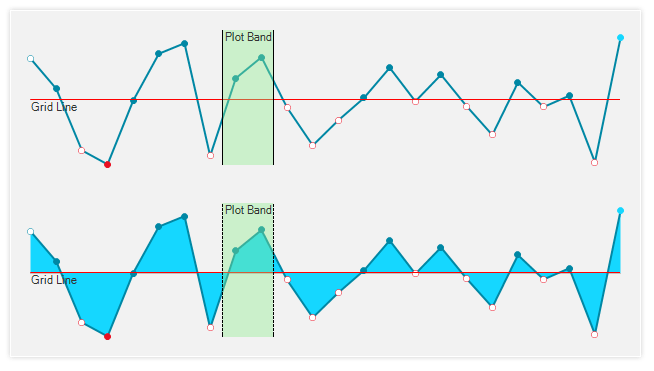
Another way to navigate the user’s attention or introduce a highlight is to use annotations to highlight the plot area. The available plot area annotations are Grid Line and Plot Band. With the former you can display lines or circles at a certain location based on the axis values, while with the latter you can indicate an entire area – from the beginning to the end of the vertical or horizontal axis.
-
Printing and Exporting
The control features convenient methods for exporting the Sparkline control to an image or to sending it to the printer.
All Winforms Components
Data Management
- CardView
- CheckedListBox
- DataEntry
- DataLayout
- FilterView
- GridView
- ListControl
- ListView
- PivotGrid
- PropertyGrid
- TreeMap
- TreeView
- Validation Provider
- VirtualGrid
Office
Data Visualization
- BarCode
- BindingNavigator
- BulletGraph
- ChartView
- Diagram
- HeatMap
- LinearGauge
- Map
- RadialGauge
- RangeSelector
- Sparkline
- TaskBoard
Interactivity & UX
Forms & Dialogs
- AboutBox
- ColorDialog
- DesktopAlert
- File Dialogs
- Flyout
- FontDropDownList
- Form
- MarkupDialog
- MessageBox
- Overlay
- RibbonForm
- ScrollBar
- ShapedForm
- SplashScreen
- StatusStrip
- TabbedForm
- TaskDialog
- TitleBar
- Toast Notification Manager
- ToolbarForm
- Wizard
Scheduling
Editors
Navigation
- ApplicationMenu
- BreadCrumb
- CommandBar
- ContextMenu
- Menu
- NavigationView
- NotifyIcon
- OfficeNavigationBar
- PageView
- Panorama
- PipsPager
- RibbonBar
- SlideView
Layout
Document Processing
Tools
Framework
