
UI for WinForms
WinForms BulletGraph
- The WinForms BulletGraph is a variation of linear gauge that combines a number of indicators into one control.
- Part of the Telerik UI for WinForms library along with 165+ professionally-designed UI controls.
- Includes support, documentation, demos, virtual classrooms, Visual Studio Extensions and more!

-
Efficient Data Presentation
The RadBulletGraph control is a variation of LinearGauge. It combines a number of indicators, as well as the data indicator into one control, which is light weight, easily customizable and straightforward to setup and use.
The control is a great tool for dashboards as it is the optimal way to present a lot of information in relatively small size.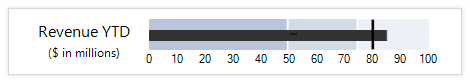
-
Full Specification Compliance
RadBulletGraph supports the full design specification: non zero-based scale, negative featured measures, projected values, having many comparative measures and quantitative ranges is not a problem.
-
Data Binding Support
The control can be easily data bound to your business data, either by setting its properties directly, or by using a binding declaration.
-
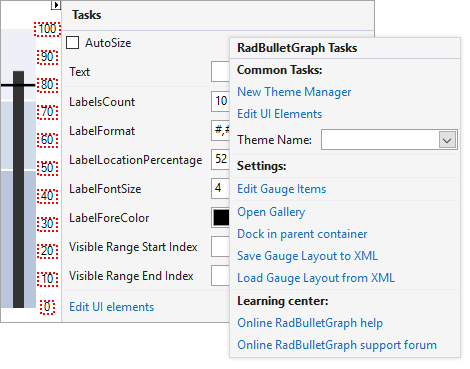
Native Design Time Experience
RadBulletGraph provides native design time experience in VisualStudio allowing you to select any of the component elements (bars, ticks, labels, needle, etc) and customize their appearance via the element Smart Tag or via the properties window of Visual Studio. In addition, new elements can be added to a gauge, or existing ones can be deleted.
-
Save/Load Layout
RadBulletGraph supports save and load layout functionality, which allows you to store your gauge setup, or to build a whole gauge gallery for your users, for them to pick from.
