UI for WinForms
WinForms PivotGrid
- The WinForms PivotGrid control provides similar functionality to the PivotTables in MS Excel.
- Part of the Telerik UI for WinForms library along with 165+ professionally-designed UI controls.
- Includes support, documentation, demos, virtual classrooms, Visual Studio Extensions and more!
-
Summarize Large Datasets in Readable Way
RadPivotGrid is a control that empowers your applications with similar functionality to the PivotTables in MS Excel. It takes large chunks of data and summarizes it in a human readable way with the help of aggregates and field descriptors.
The control offer great performance achieved through the UI virtualization used for its visual elements.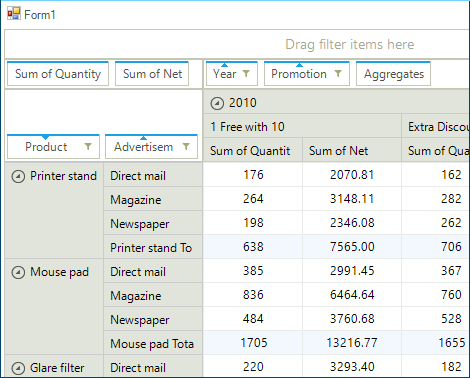
-
Flexible Pivoting
The WinForms PivotGrid control allows end-users to easily interact with and break down raw data into any fashion they desire. With a pivot table users can create summarizations and highlight specific data with a few clicks.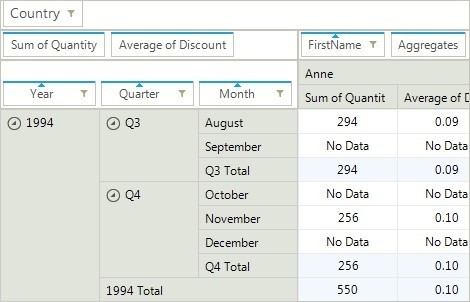
-
Full OLAP Support
RadPivotGrid comes loaded with full-fledged support for OLAP data sources featuring an OLAP browser. With its help, you not only get access to the data in an OLAP cube but also to the structure of the bound data source. The accompanying Hierarchical Field List is fully optimized to load on demand the entire structure of the bound OLAP data source.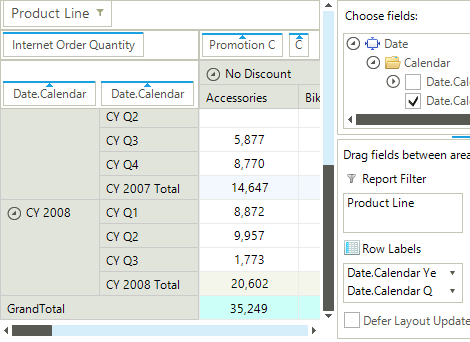
-
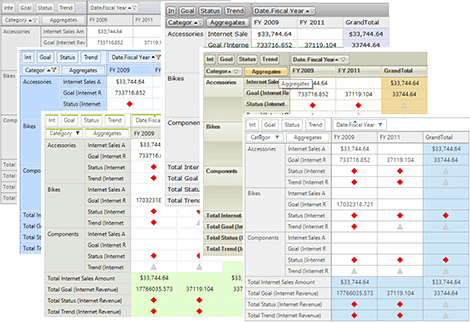
Tabular And Compact Layouts
RadPivotGrid supports two types of layouts – Tabular and Compact. The Tabular layout displays each field in a separate box – for row descriptors in a separate column, and for column descriptors in a separate row. The compact layout nests the field descriptors in one common box to optimize space which can be useful in any scenario which uses a large number of fields.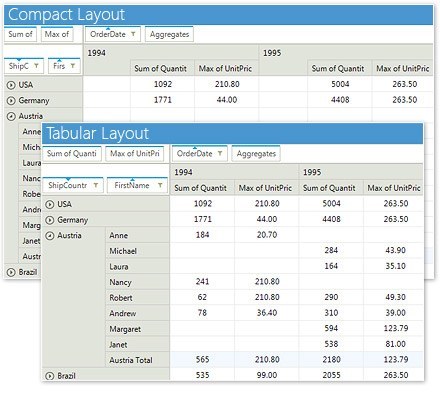
-
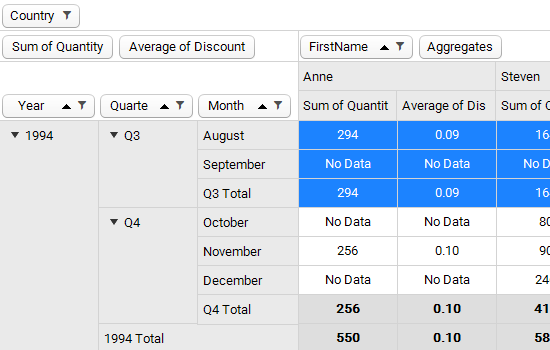
Easy Data Filtering and Sorting
As a prerequisite for each data management control, RadPivotGrid provides intuitive filtering and sorting options out of the box.-(1)-(1)-(1)-(1)-(1)-(1)-(1).png?sfvrsn=603db4f4_9)
-
Group Filtering
The standard data manipulation capabilities are complemented by group filtering options that allow your end-users to achieve the exact data view they desire. They are accessible via context menus and dialogs which pretty much resemble those available in MS Excel.-(1)-(1)-(1)-(1)-(1).png?sfvrsn=b3afa6e2_9)
-
Drag And Drop Support
The Telerik PivotGrid has the ability for you to display all of your available fields in an external window from which they can be dragged and dropped in to the control itself to group by the desired fields.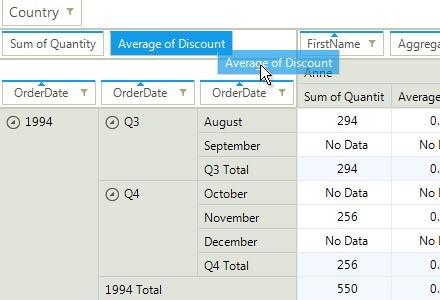
-
Export
RadPivotGrid can easily export data to native XLSX and PDF formats via the export providers using our Document Processing Libraries, PdfProcessing and SpreadProcessing.
-
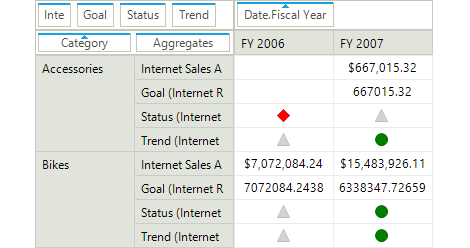
KPI Indicators
RadPivotGrid can display Key Performance Indicators (KPIs) which will allow you to quickly spot trends or evaluate current or past performance.
-
Data Binding to ChartView
RadPivotGrid enables seamless integration with RadChartView, providing users a visual indication of certain portions of the data in the control.-(1)-(1)-(1)-(1)-(1).png?sfvrsn=de345524_5)
-
Advanced Printing Options
Exploit native printing support with a bunch of customization settings available for the printing layout. Your end users can send their pivotized reports to the printer, then fine-tune the printing layout using the Print preview or Print settings dialogs. They can set page headers, page footers and watermarks, as well, and adjust paper size settings.-(1)-(1).png?sfvrsn=d358bae8_7)
-
Save/Load Layout
RadPivotGrid supports save and load layout functionality, which enables applications to preserve user RadPivotGrid settings, such as group descriptors, and restore them later. Using this functionality, users can store different layout settings of the control and switch between them, when needed. -
Calculated Fields and Calculated Items
The control enables user to add calculated fields or items, which rely on specific business logic, in row or column manually.
- A calculated field is a new data field in which the values result from a custom calculation formula. You can display the calculated field along with another data field or on its own.
- A calculated item is a new item in a row or column field in which the values are the result of a custom calculation. In this case, the calculated item’s formula references one or more items in the same field. Using Calculated Items enables you to extend RadPivotGrid with additional items that are not part of the data source.
-
Field List
RadPivotFieldList provides your users with an easy runtime customization of the RadPivotGrid reports. With it, they can change the way they represent aggregated data in RadPivotGrid by modifying the column/row group descriptions, aggregate descriptions or report filters. This can be achieved by dragging fields across the four list boxes, or by reordering the items in a single list. A deferred layout update option is also available, so users can stack changes and perform them at once. The features of the control are quite similar to the PivotTable Field List panel in Microsoft Excel.
Last, but not least, the control exposes its inner elements, so users can make additional customizations, according to their needs.
-(1)-(1)-(1)-(1)-(1).png?sfvrsn=c84d0e5_5)
-
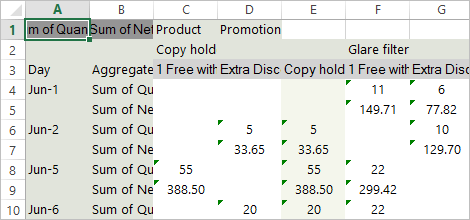
Selection and clipboard operations
The control’s cell selection functionality can be turned off by a single property setting. Other features, such as column best fit and resize, the clipboard cut/copy/paste and contextual operations delivered by the embedded context menus improve the user experience with the control.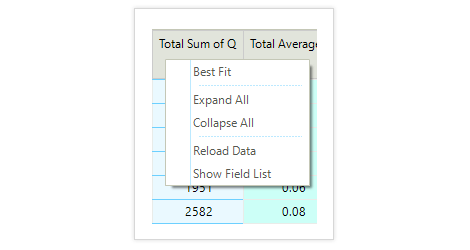
-
Fine-Grained Customizations and Tooltips
Visual elements such as cells, groups and the like, and menus in the control are accessible and highly customizable. You can change colors, fonts and directions; add/remove/replace menu items in context menus; set error text for no-data cells and much more to satisfy any UI requirement. You can also show tool tips based on the currently hovered element in the control. -
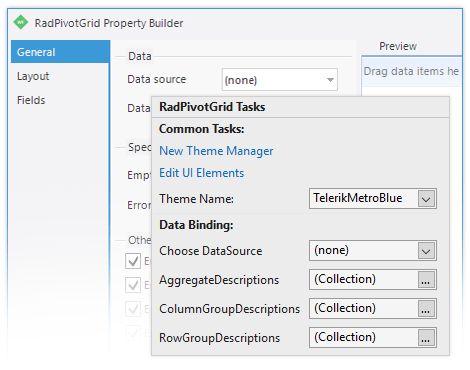
Extensive VS.NET Design-time Support
RadPivotGrid provides rich design-time support functionality, making customizations and configurations very easy. Some key capabilities include:
- A dedicated Property Builder, which aids the control setup at design time
- Convenient properties exposed at the control Smart Tag for quick control setup
- The ability to apply themes in design time and switch between them; the ThemeName property in the Smart tag automatically detects the present themes
- Visual Style Builder, Element Hierarchy Editor and Shape Editor productivity tools for full control over the UI
- Options to search the forums or open the control online documentation in the Smart Tag
-
Localization Support
Business globalization requires multilingual applications. RadPivotGrid supports full localization of its strings. See Localization and Right-to-Left Support for the full list of controls supporting RTL and localization. -
Appearance
The control is shipped with a rich set of themes that enable you to easily build slick interfaces with the look and feel of Windows Vista, Office 2007, Outlook and so on. Themes can be switched easily using a single property.
In addition our framework supports custom themes, which you can build from scratch to fit your exact visual demands, using the Visual Style Builder productivity tool.