UI for WinForms
WinForms HeatMap
- Telerik UI for WinForms HeatMap offers a visual representation of numeric data using indicative colors.
- Part of the Telerik UI for WinForms library along with 165+ professionally-designed UI controls.
- Includes support, documentation, demos, virtual classrooms, Visual Studio Extensions and more!
-
HeatMap Visualization Capabilities
The WinForms HeatMap control offers a comprehensive visual representation of numeric data through indicative colors in a two-dimensional layout. It includes a diverse range of built-in features, such as data binding, screen tooltips, labels, customizable cells, row and column headers, colonizers and more.

-
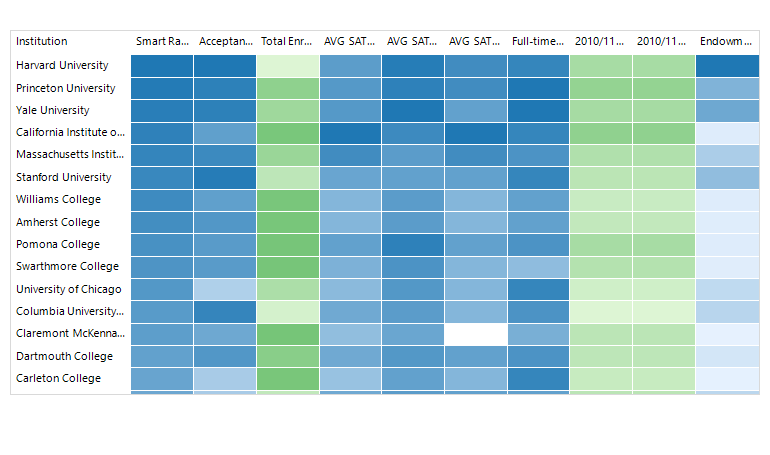
Categorical Visualization Definition
In the Categorical Definition mode, each HeatMap cell represents one data item or object from the data source. All cells are assigned a single colorizer, which determines their color based on the data values.
See the WinForms HeatMap docs: Populating with data in Categorical Definition
-
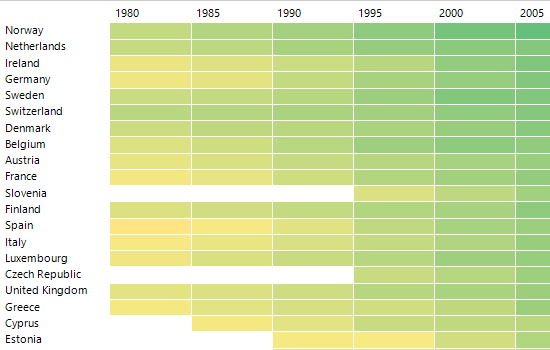
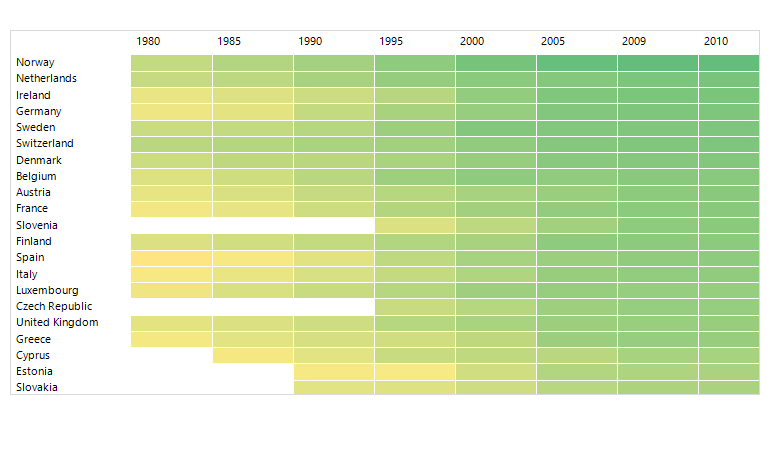
Horizontal/Vertical Visualization Definition
In this mode, each data item or object is visualized on an entire row. The number of rows in the HeatMap is equal to the count of data items. Multiple colorizers can be set for the control, allowing for different color assignments based on specific criteria.
See the WinForms HeatMap docs: Populating with data in Vertical Definition
-
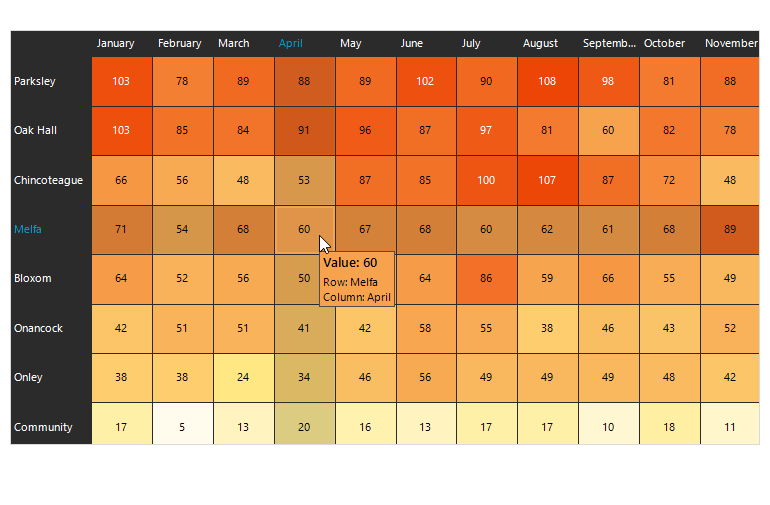
Row/Column Headers
The Telerik UI for WinForms HeatMap control provides the ability to set Row/Column headers, offering additional clarity to the displayed data. These headers can be easily customized using an intuitive API, allowing you to adjust various aspects such as font size, color family, weight and more.
-
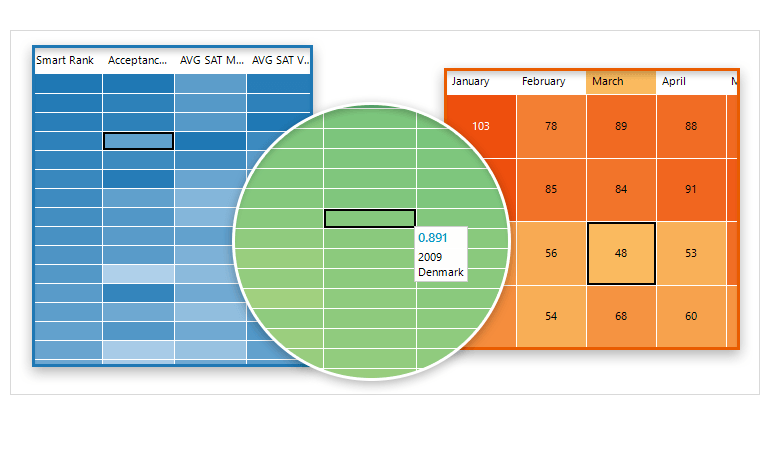
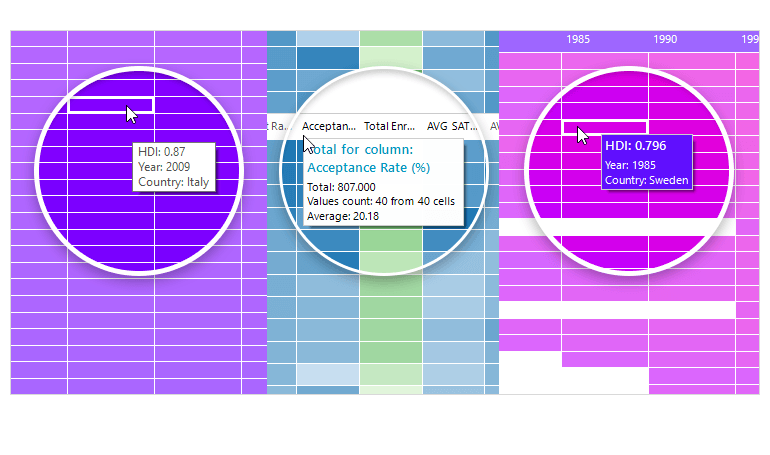
ScreenTips
Experience the convenience of fully customizable screen tips that offer context-aware details without overwhelming the summary. You can edit multiple elements in your ScreenTip and add a header, text, image, value and more. Additionally, you can change the ScreenTip color or stick to the automatically determined one by the selected theme. If you prefer a more traditional user interface in your app, you can use ToolTips as well.
-
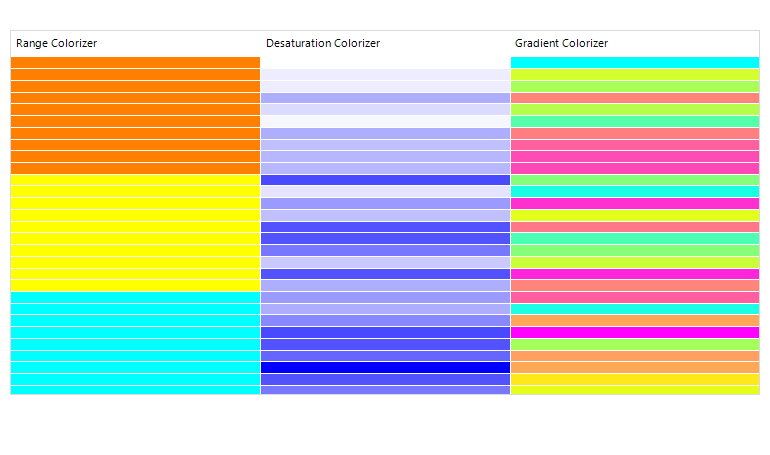
Colorizers
The Telerik UI for WinForms HeatMap control offers a variety of colorizers that determine the coloring mechanism within the control:
- Gradient Colorizer – this colorizer utilizes a collection of GradientStops to assign colors based on the values of items in the HeatMap. The color applied is determined by the gradient stops defined within the colorizer.
- Range Colorizer – with this colorizer, a set of colors is assigned to specific ranges. Each range corresponds to a particular color, allowing for customized color assignments based on value ranges.
- Desaturation Colorizer – this colorizer reduces the saturation level of a specified StartColor based on the value of each HeatMap item. The level of desaturation is determined by the item's value, resulting in varying levels of saturation across the HeatMap.
-
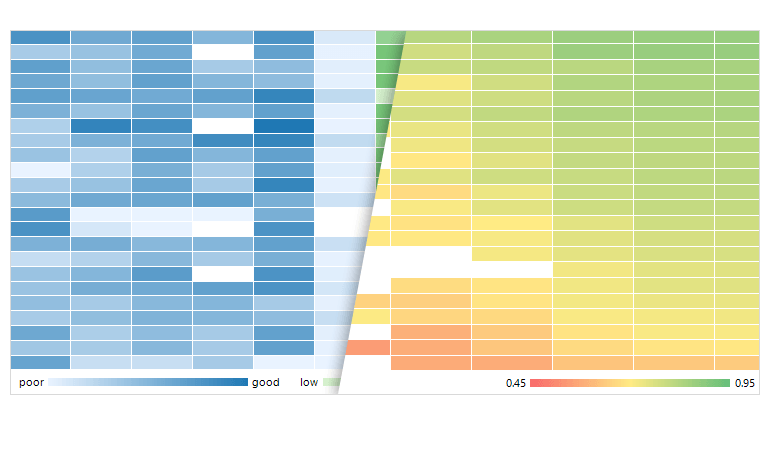
Legend Support
The WinForms HeatMap control comes with built-in Legend support that shows the criteria for colorizing values on the plot. It is generated by default based on your data, but you can also customize it. You decide whether to show the HeatMap Legend or let the numeric data speak for itself.
-
Two Approaches to Data
The control offers a user-friendly Categorical and Horizontal/Vertical data-definition API that allows you to map your data properties directly or automatically generate groups based on unique values. This API is designed to provide simplicity and to ensure that the data mapping process is optimized and efficient.
-
Selection
With the WinForms HeatMap control you can visually select its cells. This is represented by a border around the selected cell and is initially disabled. You can customize the selection behavior by choosing from the following selection modes:
- None – selection is disabled.
- Single Data Item – only a single data item can be selected through user interaction.
- Multiple Data Items – multiple data items can be selected through user interaction.