
UI for .NET MAUI
.NET MAUI Charts Overview
- The .NET MAUI Charts library is a feature-rich and easy to use data visualization collection of chart series.
- Part of the Telerik UI for .NET MAUI library along with 70+ professionally-designed UI controls.
- Includes support, documentation, demos, learning resources and more!
-
Full-featured Charts to Easily Visualize Data in Your .NET MAUI Apps
The Telerik UI for .NET MAUI Charts features a large collection of charts and graph types that allow you to visualize data according to native desktop and mobile standards. The Telerik Charts for .NET MAUI allows developers to easily implement various chart scenarios in their apps from a single shared C# code base.
-
Great Looking, Easy to Use and Highly Performant
The Telerik UI for .NET MAUI Charts is designed with the sole purpose of helping developers achieve their cross-platform application requirements and boost their productivity along the way. We have put a lot of effort into keeping the perfect balance between the three main pillars - easy to implement and work with, highly customizable look and feel and great performance with large volumes of data.
-
Area Chart
The Area graphs for .NET MAUI are another way to visualize data that spreads in time. However, it is used for showing or comparing the areas for different data points. You can customize the axis to show numeric, categorical and date/time points, giving you wide customization options.
-
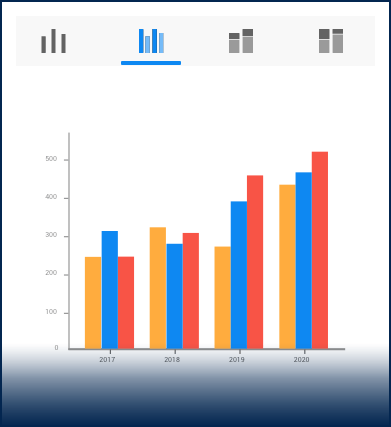
Bar Chart
Telerik UI for .NET MAUI Bar charts can be visualized either horizontally or vertically. This graph is among the most commonly used and it is highly suitable for comparing different types of data.
-
Line Series
The Line Series Charts of the Telerik UI for .NET MAUI suite visualizes and connects each data item with straight line segments. The axis can be configured to show numeric, categorical or date/time points. -
Spline Chart
The Telerik UI for .NET MAUI Spline graph draws curved instead of straight lines in order to allow smooth data representation. Just as in the .NET MAUI Line chart, the axis can be configured to show numeric, categorical or date/time points.
-
SplineArea Series
The Spline Area Series for .NET MAUI Charts enables you to visualize an area on the chart that is enclosed by the coordinate axes and straight line segments that connect the data points represented by these series. The series are highly customizable and enable you to define the stroke color, thickness and fill area.
See the .NET MAUI Charts documentation: SplineArea series -
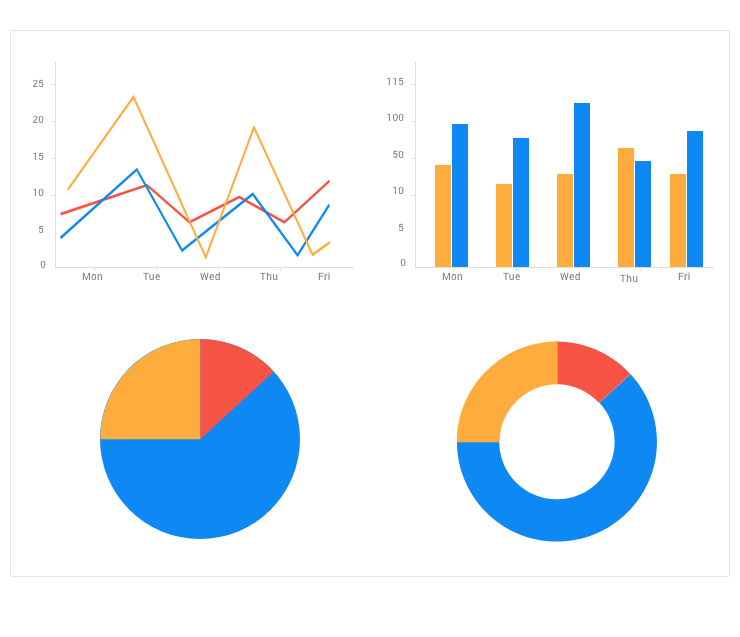
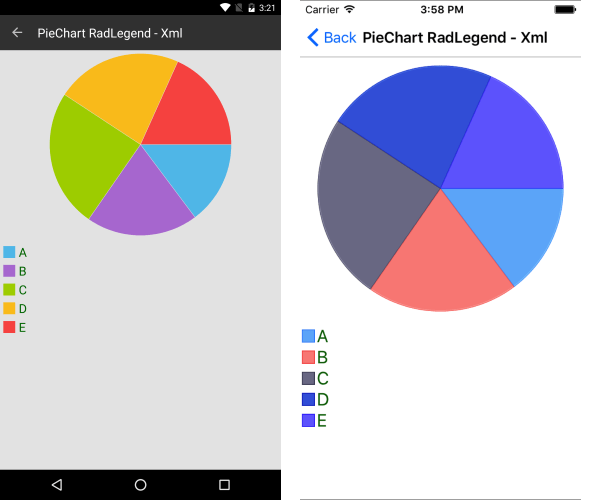
Pie Chart
The Telerik UI for .NET MAUI Pie chart visualizes its data points using radial coordinate system and is one of our circular graphs that is best for representing data in percentage and comparing its different data points to one another.
-
Donut Chart
The Telerik UI for .NET MAUI Donut graph represents data in a shape of a donut and is another form of the common Pie chart, where more than one set of data can be visually represented in a clean and coherent way. This is a useful approach to compare data more easily with respect to time.
-
Categorical Axis
The Cartesian Charts for Telerik UI for .NET MAUI uses the Cartesian coordinate system to plot the data points in its chart series. The charts include a categorical axes where the data points are arranged in categories.
See the .NET MAUI Charts documentation: Categorical axis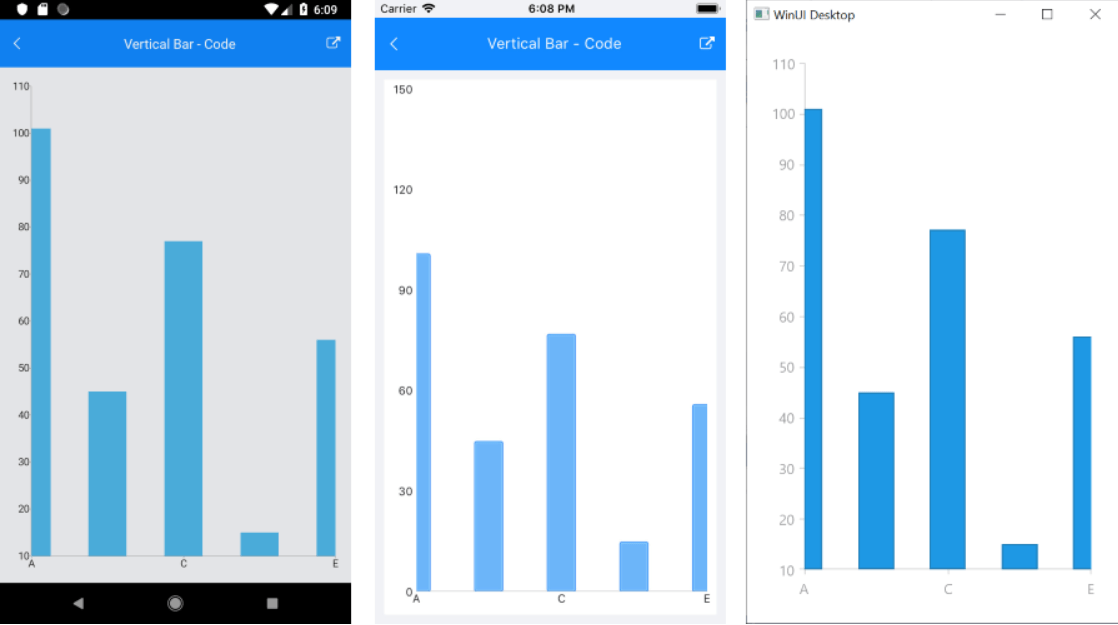
-
Numerical Axis
The Numerical axis chart type is an indispensable part of the Cartesian coordinate system. The chart type calculates the coordinate of each data point on its actual numerical value this point provides for the axis.
See the .NET MAUI Charts documentation: Numerical axis -
DateTimeContinuous Axis
The DateTimeContinuous Axis is a hybrid between a Categorical and a Numerical axis. The chart type works with categorical data but instead of categories, the axis builds time slots depending on its values. Think of this chart type as a timeline where the coordinate of each data point is calculated depending on the position of its associated DateTime on the time line.
See the .NET MAUI Charts documentation: DateTimeContinuous axis.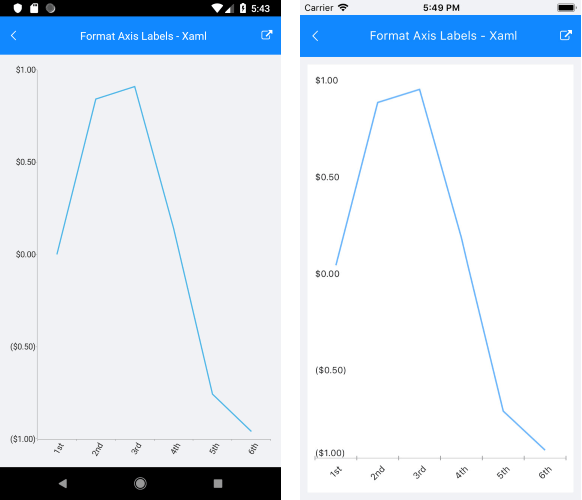
-
Legend Support
The Telerik UI for .NET MAUI Charts Legend feature displays a set of items, which correspond to the chart content making it easy for you to provide descriptions for the series visualized within the control.
-
Annotations
You can use annotations in your Telerik UI for .NET MAUI Charts whenever you need to highlight certain areas or points on the plot. You can easily define annotations on any point of the plot area and customize their appearance.
See the .NET MAUI Charts documentation: Annotations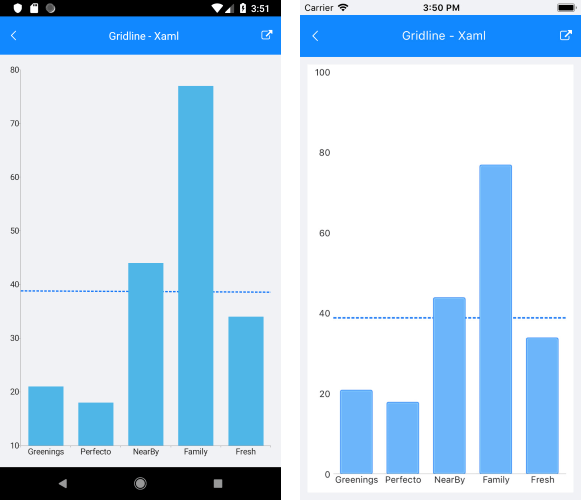
-
Also Available...
The Charts component is also available for these popular frameworks:
