UI for .NET MAUI
.NET MAUI Pie Chart
- Telerik UI for .NET MAUI Pie Chart is a feature-rich, intuitive, and easy to use data visualization tool.
- Part of the Telerik UI for .NET MAUI library along with 70+ professionally-designed UI controls.
- Includes support, documentation, demos, learning resources and more!
-
Visualize Data with .NET MAUI Pie Chart
The Telerik UI for .NET MAUI Pie chart visualizes its data points using radial coordinate system and is one of our circular graphs that is best for representing data in percentage and comparing its different data points to one another.
-
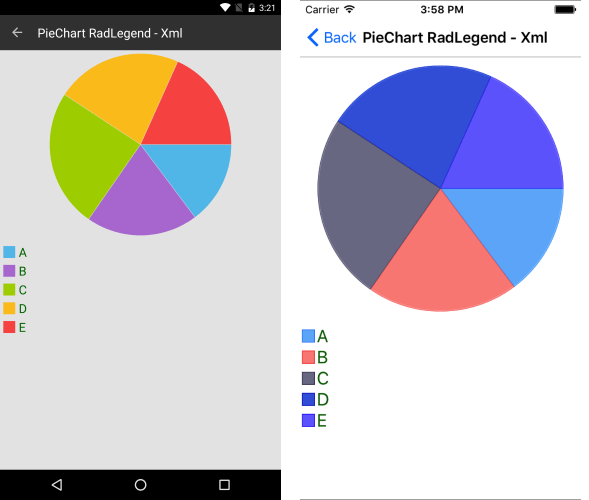
Legend Support
The Telerik UI for .NET MAUI Charts Legend feature displays a set of items, which correspond to the chart content making it easy for you to provide descriptions for the series visualized within the control.