
UI for .NET MAUI
.NET MAUI Scatter Point Chart
- Telerik UI for .NET MAUI Scatter Point Chart is a feature-rich, intuitive, and easy to use data visualization tool.
- Part of the Telerik UI for .NET MAUI library along with 70+ professionally-designed UI controls.
- Includes support, documentation, demos, learning resources and more!
-
Represent Data with .NET MAUI ScatterPoint Charts
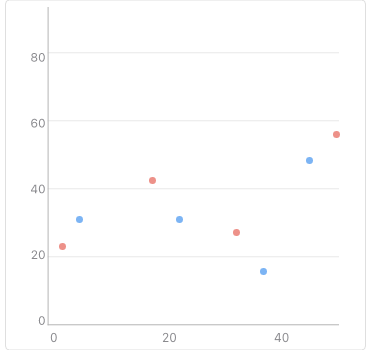
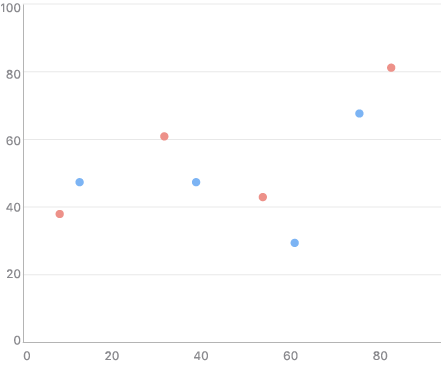
The ScatterPoint Series Charts of the Telerik UI for .NET MAUI suite are represented on the chart as data points that are not connected. Each scatter data point has to provide values for the X and Y coordinates on the RadCartesianChart. The ScatterPoint Series require both axes of the chart to be Numerical Axes.
-
Numerical Axis
The Numerical axis chart type is an indispensable part of the Cartesian coordinate system. The chart type calculates the coordinate of each data point on its actual numerical value this point provides for the axis.
See the .NET MAUI Charts documentation: Numerical axis -
Legend Support
The Telerik UI for .NET MAUI Charts Legend feature displays a set of items, which correspond to the chart content making it easy for you to provide descriptions for the series visualized within the control.
-
Annotations
You can use annotations in your Telerik UI for .NET MAUI Charts whenever you need to highlight certain areas or points on the plot. You can easily define annotations on any point of the plot area and customize their appearance.
See the .NET MAUI Charts documentation: Annotations
