
UI for .NET MAUI
.NET MAUI Donut Chart
- Telerik UI for .NET MAUI Donut Chart is a feature-rich, intuitive, and easy to use data visualization tool.
- Part of the Telerik UI for .NET MAUI library along with 70+ professionally-designed UI controls.
- Includes support, documentation, demos, learning resources and more!
-
Represent Data in the Donut Shape with .NET MAUI Donut Control
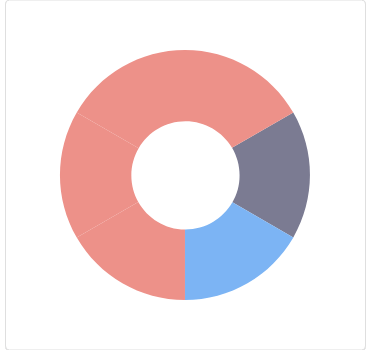
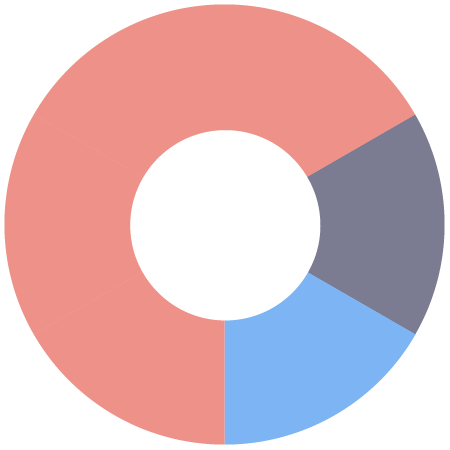
The Telerik UI for .NET MAUI Donut graph represents data in a shape of a donut and is another form of the common Pie chart, where more than one set of data can be visually represented in a clean and coherent way. This is a useful approach to compare data more easily with respect to time.
-
Legend Support
The Telerik UI for .NET MAUI Charts Legend feature displays a set of items, which correspond to the chart content making it easy for you to provide descriptions for the series visualized within the control.
