UI for .NET MAUI
.NET MAUI Bar Chart
- Telerik UI for .NET MAUI Bar Chart is a feature-rich, intuitive, and easy to use data visualization tool.
- Part of the Telerik UI for .NET MAUI library along with 70+ professionally-designed UI controls.
- Includes support, documentation, demos, learning resources and more!
-
Visualize Data with .NET MAUI Bar Charts
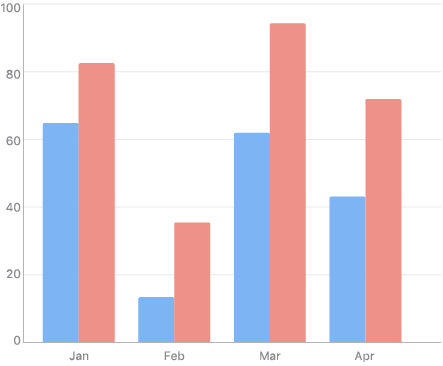
Telerik UI for .NET MAUI Bar charts can be visualized either horizontally or vertically. This graph is among the most commonly used and it is highly suitable for comparing different types of data.
-
Numerical Axis
The Numerical axis chart type is an indispensable part of the Cartesian coordinate system. The chart type calculates the coordinate of each data point on its actual numerical value this point provides for the axis.
See the .NET MAUI Charts documentation: Numerical axis -
Categorical Axis
The Cartesian Charts for Telerik UI for .NET MAUI uses the Cartesian coordinate system to plot the data points in its chart series. The charts include a categorical axes where the data points are arranged in categories.
See the .NET MAUI Charts documentation: Categorical axis
-
DateTimeContinuous Axis
The DateTimeContinuous Axis is a hybrid between a Categorical and a Numerical axis. The chart type works with categorical data but instead of categories, the axis builds time slots depending on its values. Think of this chart type as a timeline where the coordinate of each data point is calculated depending on the position of its associated DateTime on the time line.
See the .NET MAUI Charts documentation: DateTimeContinuous axis.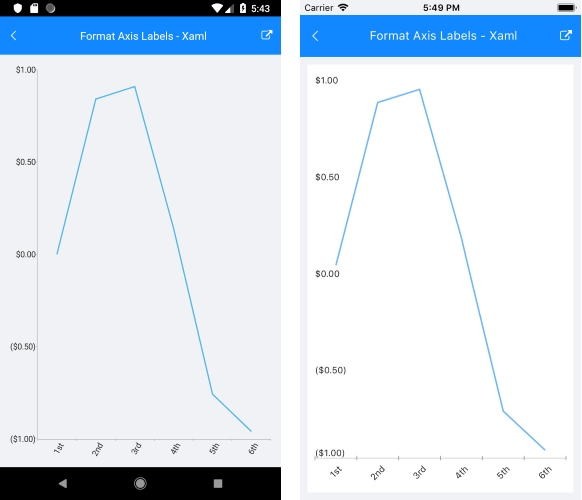
-
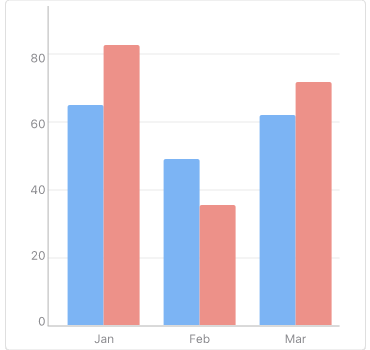
Legend Support
The Telerik UI for .NET MAUI Charts Legend feature displays a set of items, which correspond to the chart content making it easy for you to provide descriptions for the series visualized within the control.
-
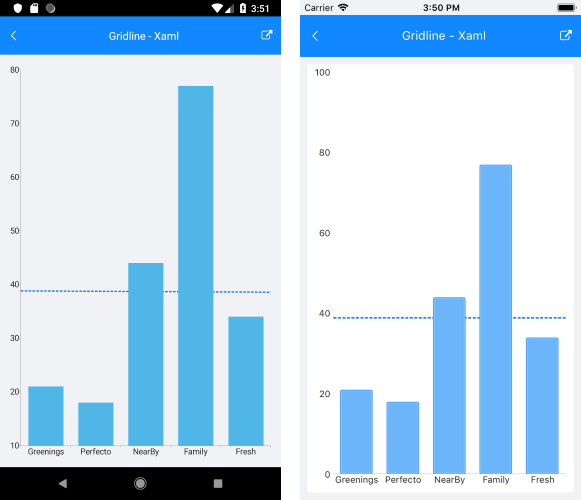
Annotations
You can use annotations in your Telerik UI for .NET MAUI Charts whenever you need to highlight certain areas or points on the plot. You can easily define annotations on any point of the plot area and customize their appearance.
See the .NET MAUI Charts documentation: Annotations