
UI for .NET MAUI
.NET MAUI Financial Chart
- Telerik UI for .NET MAUI Financial Chart is a feature-rich, intuitive, and easy to use data visualization tool.
- Part of the Telerik UI for .NET MAUI library along with 70+ professionally-designed UI controls.
- Includes support, documentation, demos, learning resources and more!
-
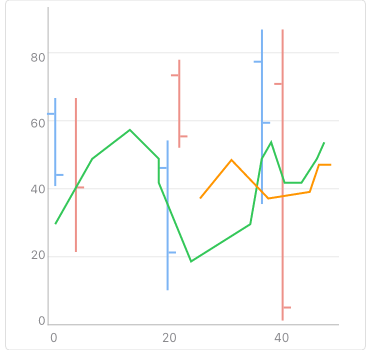
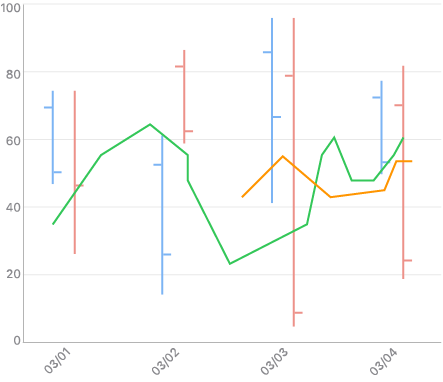
Visualize Financial Data with .NET MAUI Financial Charts
The financial, or also called stock, indicators are mainly used for keeping track of stock prices and patterns of price changes over time. They are a key part of the Financial Charts of the Telerik UI for .NET MAUI suite.
-
Legend Support
The Telerik UI for .NET MAUI Charts Legend feature displays a set of items, which correspond to the chart content making it easy for you to provide descriptions for the series visualized within the control.
-
Annotations
You can use annotations in your Telerik UI for .NET MAUI Charts whenever you need to highlight certain areas or points on the plot. You can easily define annotations on any point of the plot area and customize their appearance.
See the .NET MAUI Charts documentation: Annotations
