
UI for .NET MAUI
.NET MAUI Candlestick Chart
- Telerik UI for .NET MAUI Candlestick Chart is a feature-rich, intuitive, and easy to use data visualization tool.
- Part of the Telerik UI for .NET MAUI library along with 70+ professionally-designed UI controls.
- Includes support, documentation, demos, learning resources and more!
-
Visualize Data with .NET MAUI Candlestick Charts
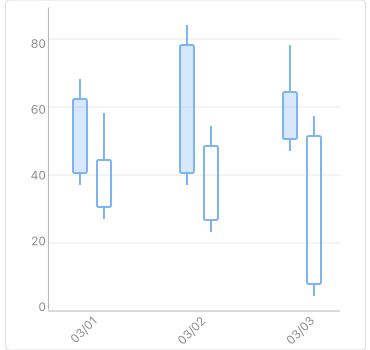
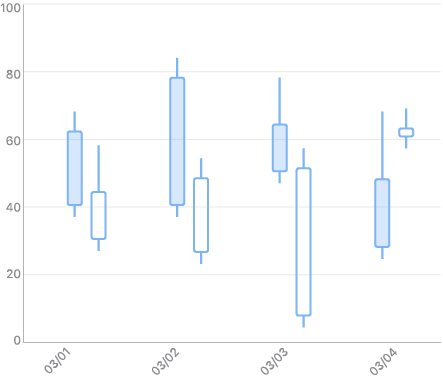
The .NET MAUI Cartesian Chart visualizes each data point from the Candlestick Series as a visual that resembles a candlestick. This is a typical financial series that can be used to visualize the state of a market for a period of time. The series operates with a special kind of data in the form of four parameters defining the stock market - open, high, low, and close. The high and low values show the price range (the highest and lowest prices) over one unit of time. The open and close values indicate the opening and closing price of the stock for the corresponding period.
-
Legend Support
The Telerik UI for .NET MAUI Charts Legend feature displays a set of items, which correspond to the chart content making it easy for you to provide descriptions for the series visualized within the control.
-
Annotations
You can use annotations in your Telerik UI for .NET MAUI Charts whenever you need to highlight certain areas or points on the plot. You can easily define annotations on any point of the plot area and customize their appearance.
See the .NET MAUI Charts documentation: Annotations
