
UI for WPF
WPF ChartView
- The Telerik ChartView for WPF helps you to visualize data in compact and precise formats, accommodating any use case from comparisons and trends to sophisticated analysis with box plot, polar plot, funnel series, financial series and more.
- Part of the Telerik UI for WPF library along with 165+ professionally-designed UI controls.
- Includes support, documentation, demos, virtual classrooms, Visual Studio Extensions and more!
-
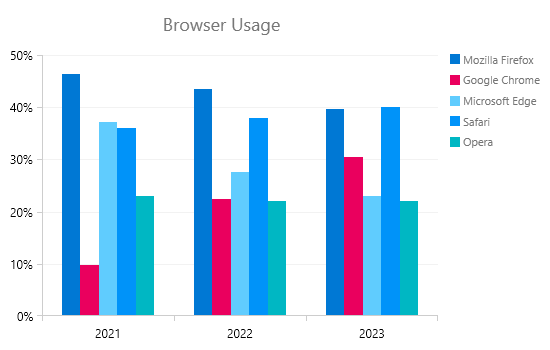
Powerful Charting Components
Take advantage of powerful charting components to help your users display and analyze complex data. Facilitate their decision-making process through the rich data visualization support the charting components provide.
-
Support for BoxPlot Series Type
This way of depicting data utilizes a plot with a box in the middle and shows groups of numerical data through their quartiles. The ChartView component enables you to visualize each data point through a five-way segmented visual: minimum, maximum, lower quartile, upper quartile and median, which makes the data a lot more comprehensible.
For more information on how to use Box Plot series check out the product documentation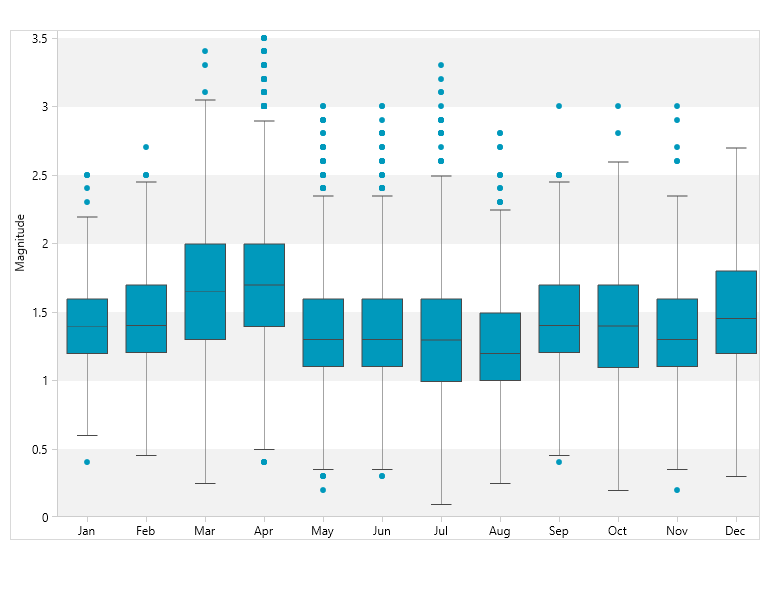
-
Excellent Performance
Easily create live-data experiences with updates as fast as the eye can see.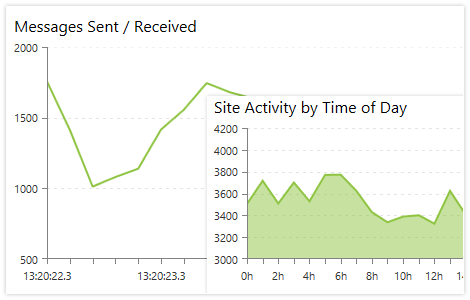
-
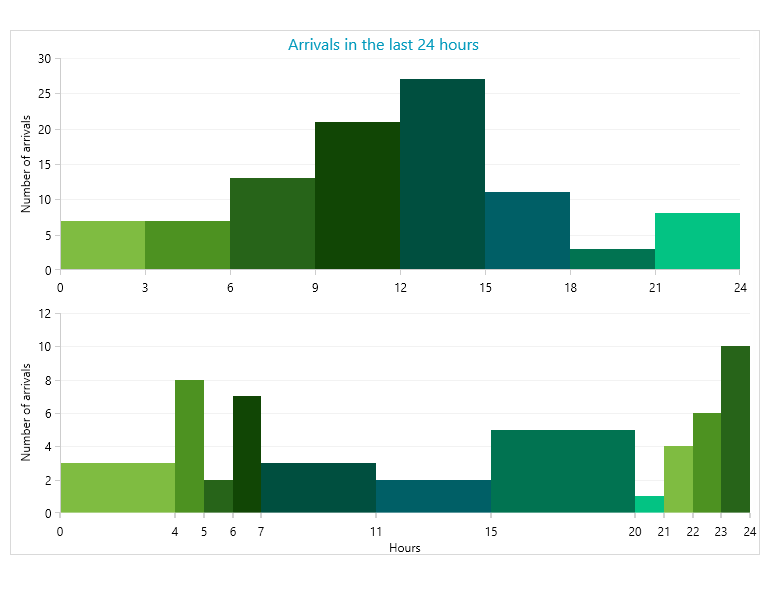
Histogram Series Support
The ChartView series is designed to enable you to create and visualize a histogram—a bar graph that represents a frequency distribution. The X axis represents an interval, and the Y axis represents the corresponding frequency.
-
Funnel Series Type Support
This powerful functionality is very useful to visualize bottlenecks in various scenarios, such as sales processes, marketing lead qualification, website visitors, etc., by evaluating what percentage or number of people from a group have moved from one stage of the funnel to the next and the estimating the final pool.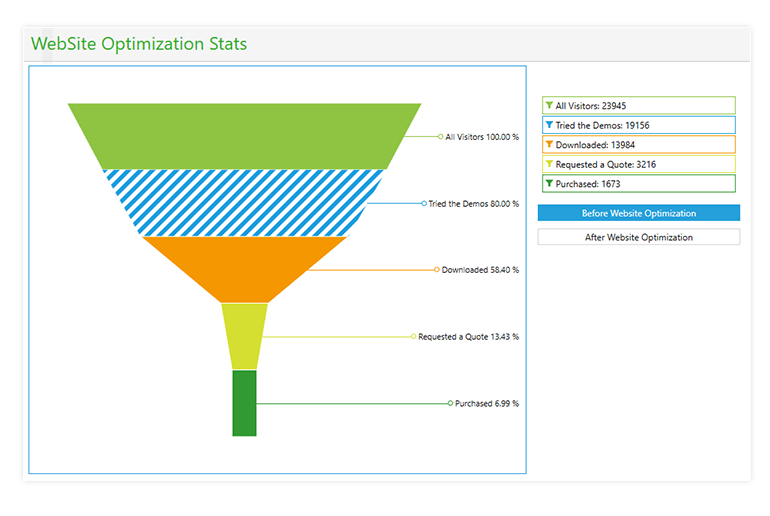
-
Polar/Radar Chart Support
Display data in a variety of charts like polar or radar line, area and point series.
-
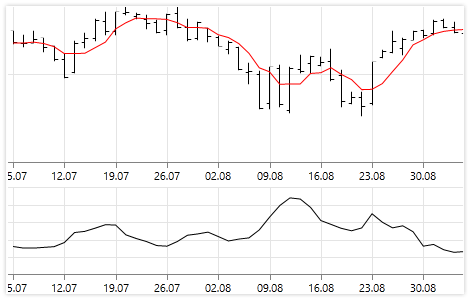
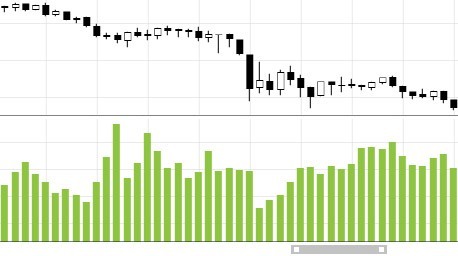
Financial Series Support
Take advantage of the OHLC (open-high-low-close chart) and the CandleStick chart types to conveniently visualize data in financial-based applications.
-
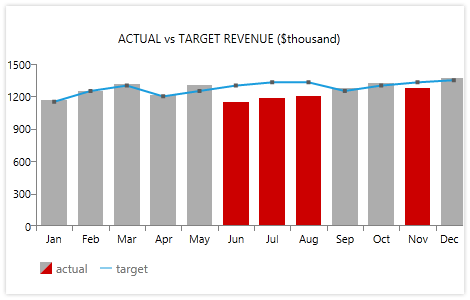
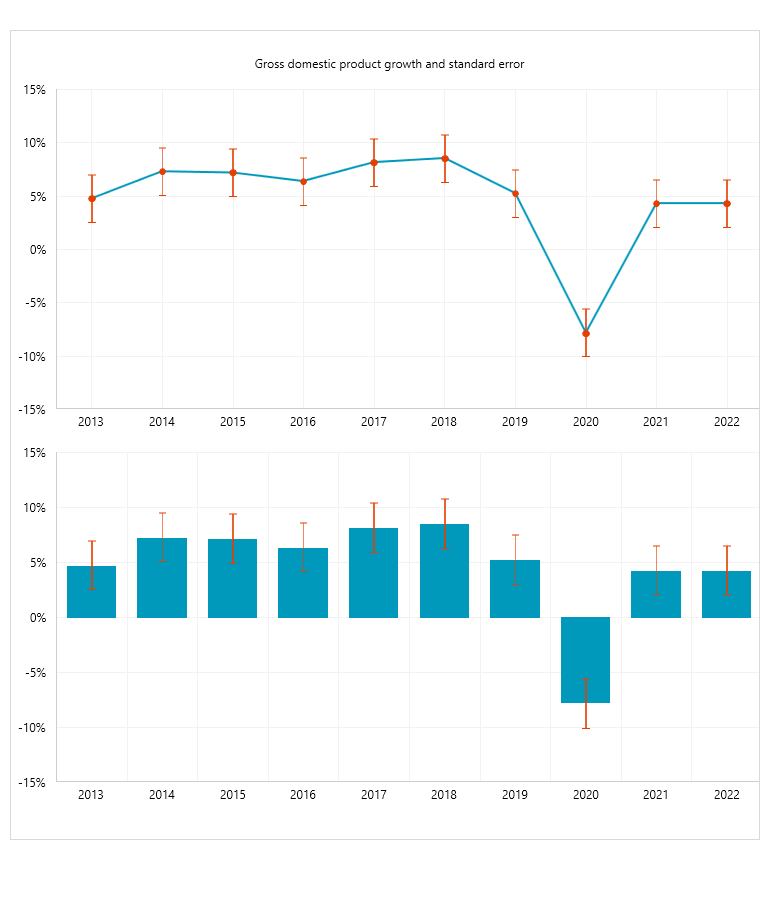
ErrorBar Series Support
This type of series visualizes its data points using error bar shapes. The error bar series allow displaying an error or uncertainty in the plotted data.
-
Series Animations Support
Charts are a powerful way to display data in an easy to understand manner, but are commonly static and less visually appealing. With the chart series animations in the Telerik UI for WPF ChartView control you get additional customization options and a sleek UX to the application’s end users.
-
Built-In Zoom and Scroll
Trigger the built-in scrolling feature of the charts and display larger sets of the data without limiting the size of the component by enabling the ChartPanAndZoomBehavior.
-
Orientation Support
Easily change the orientation of chart series.
-
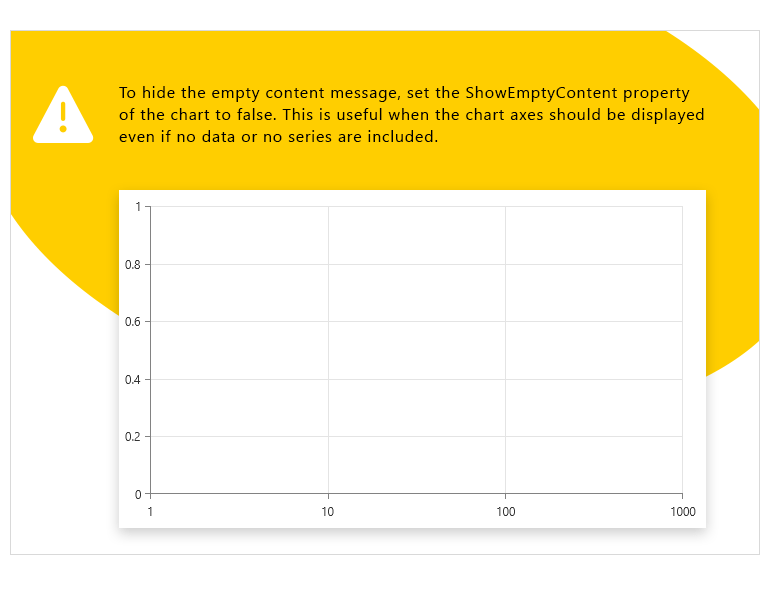
Support for Axes Rendering When No Data Is Available
In scenario when there is no available data, the Telerik UI for WPF ChartView can still visualize its X and Y axes.
-
Built-In Integration With RadLegend
Take advantage of the built-in integration with the RadLegend component to display a relevant legend next to your charting components.
-
Smart Labels
Use the built-in Smart Labels functionality to automatically re-align overlapping labels, making each labeled value stand-out clearly.
-
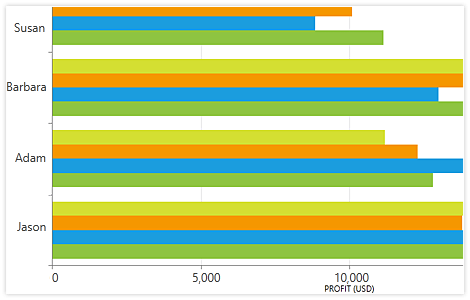
Combine Mode
Set the combine mode property to allow for stack, stack100 and cluster views.
-
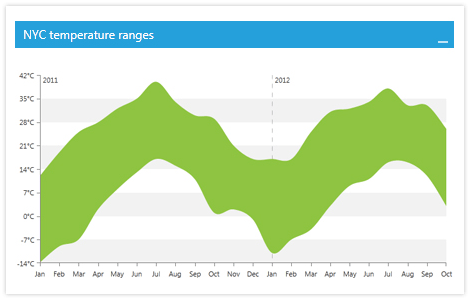
RangeSplineSeries
Take advantage of powerful charting components to help users display and analyze complex data. Facilitate their decision-making process through rich data visualization support.
The new series type RangeSplineSeries provides yet another option for even richer data visualization.
-
Also Available...
The Chart control is also available for these popular frameworks:
