UI for ASP.NET MVC
ASP.NET MVC StockChart
- Navigate the price movements of any financial instrument over a certain period of time with the ASP.NET MVC StockChart component.
- Part of the Telerik UI for ASP.NET MVC library along with 110+ professionally designed UI components.
- Includes support, documentation, demos, virtual classrooms and more!
-
Overview
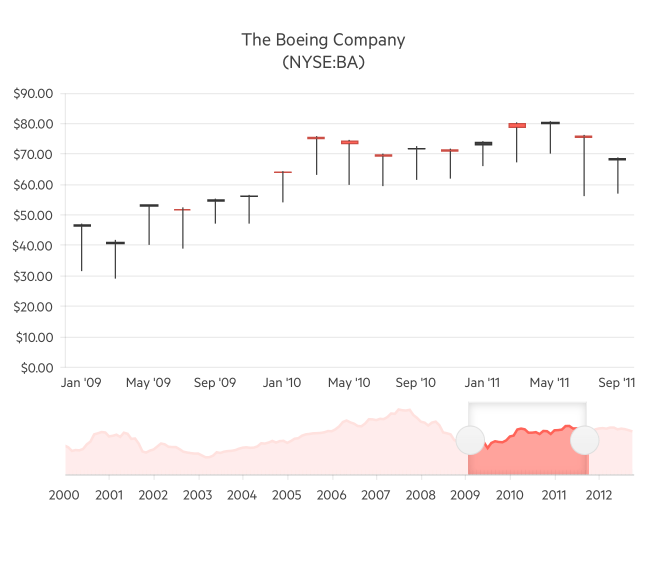
The Telerik UI for ASP.NET MVC Stock Chart is a combination of Line and Candlestick charts representing historical stock prices. It helps you visualize the price movement of any financial instrument. The Stock Chart shares most of the Telerik Chart features and includes extensive touch support and a navigator pane for easy browsing of extended time periods.
-
Data Binding
The MVC Stock Chart component is data bound, thus its data series can contain extra information, including open/close values, min/max values and a DateTime field for the x-axis. In addition, the chart provides two data-source binding modes: single data source and master and navigator data source.

-
Chart Types
The Telerik UI for ASP.NET MVC Stock Chart supports five different series types:- Line visualizes trends
- Area shows price movements in a long timeframe
- OHLC presents price movements over time
- Column illustrates volume
- Candlestick describes price movements
-
Multiple Panes
Multiple panes can be defined and used in the ASP.NET MVC Stock Chart to present data in a clearer way. For an ultimate user experience, you can enable the built-in scrolling through data feature, which lets users adjust the time period to the one they are interested in.
Check out the Telerik UI for ASP.NET MVC Stock Chart Multiple Panes demo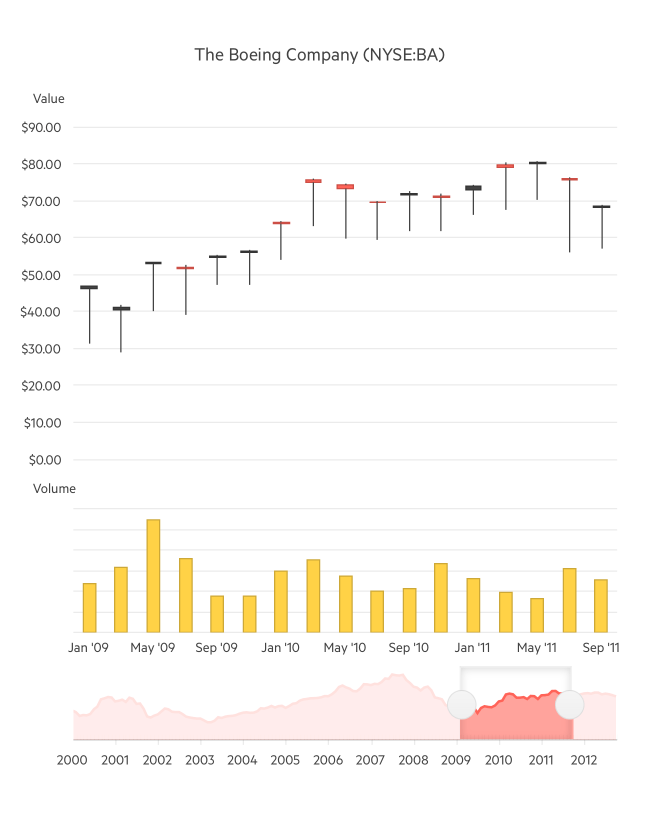
-
Crosshairs
The Crosshairs are another part of the MVC Stock Chart component. They are a pair of lines, intersecting at the current mouse position, which provide a visual cue for the user to zoom in on a single data point and read its value. When working with large amounts of data and/or a large time interval, Crosshairs let you see precise values and not just the overall trend. -
Navigator
The Navigator is a part of the ASP.NET MVC Stock Chart component. It lets users explore and navigate through all the information on the chart by jumping to a given date or narrowing down to a particular period to see fine-grained details and extract valuable information. Based on the specific requirements of your app, you can easily position the Navigator on top or at the bottom of the Stock Chart.
See the Telerik UI for ASP.NET MVC StockChart Navigator demo
.png?sfvrsn=e6047e91_1)
-
Stock Chart Virtualization
For the purpose of visualizing rich data, the Stock Chart has a virtualization functionality that can be easily enabled through the DataSource -> ServerOperation(true) method. This comes in handy when dealing with large amounts of data as the component would initially load only a small portion of data needed and later on load the rest if the user has changed the time period or scrolled the component. -
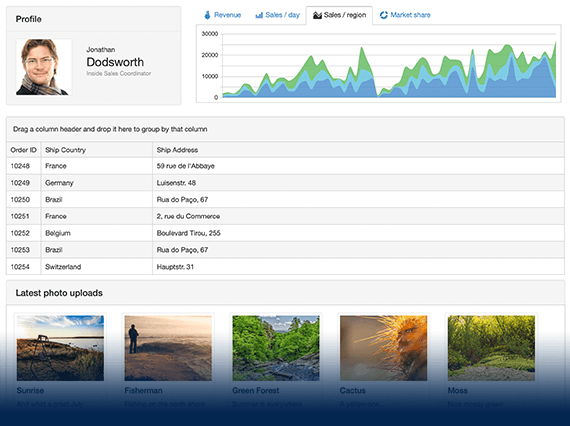
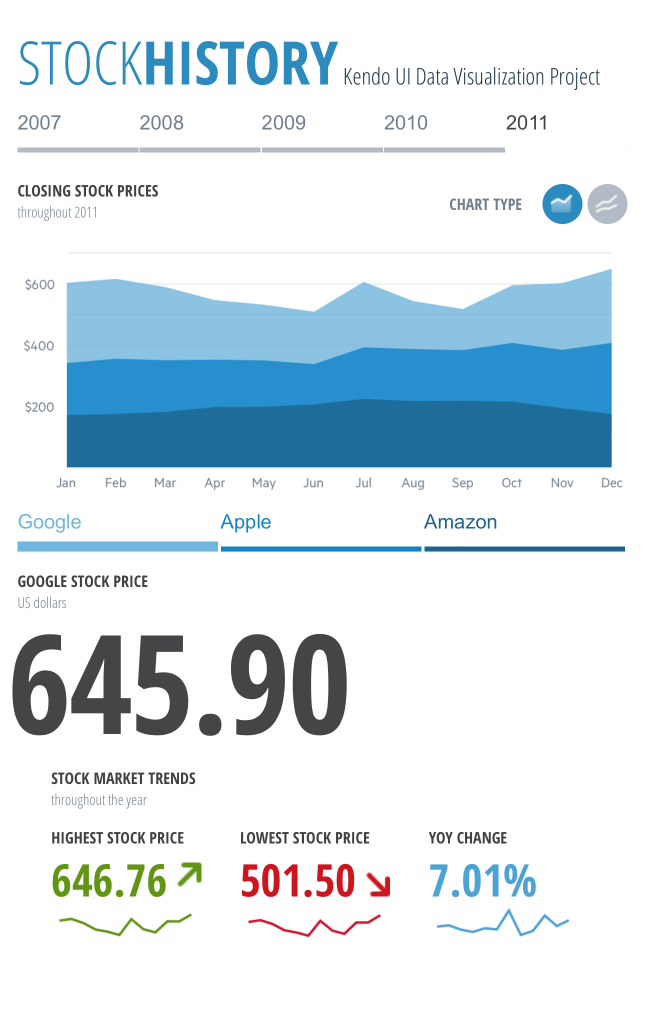
Stock History Dashboard
The Stock History Dashboard shows the charting components in a complex finance application scenario.
-
PDF Export
Charts are a valuable resource when analyzing market performance, which is why most of the time you would need to export them and use them in a presentation or include them in an email. The PDF export option grants you this opportunity and even lets you specify Author, Creator, Date, FileName, AllPages, PaperSize and many other details when exporting the chart. -
Theming
You can style the Stock Chart with the help of the built-in themes and swatches the component comes with. Explore the Default (our own styling), Material (based on the Material Design guidelines), Bootstrap (which resembles the Bootstrap styling to integrate better) and Fluent (based on Microsoft Fluent UI) themes and choose the swatch that best suits your application.
You can easily customize the available themes with a few lines of CSS or create a new one with the Progress SASS ThemeBuilder application to meet your client’s design requirements.