UI for WinUI
WinUI HeatMap
- Flexible HeatMap control for WinUI applications for displaying dense data in a user friendly manner.
- Part of the professionally-designed Telerik UI for WinUI library controls.
- Includes support, documentation, demos, Visual Studio Extensions and more!
-
Overview
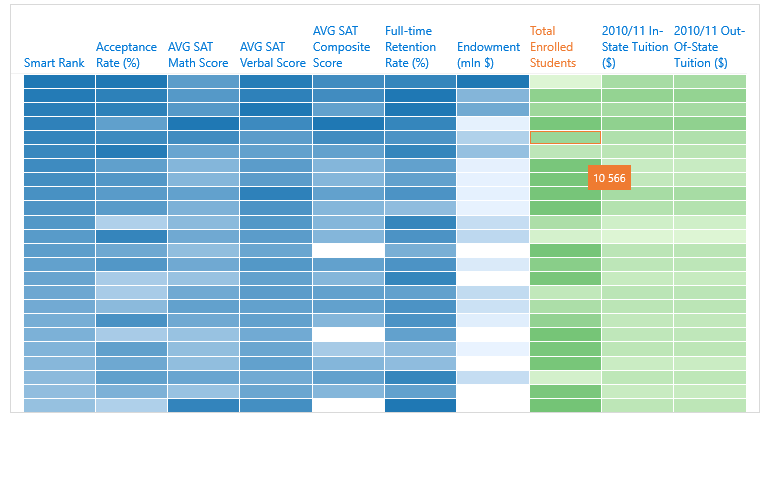
Integrate beautiful data visualizations that use colors to represent values into your WinUI applications with the Telerik Heat Map control for WinUI.
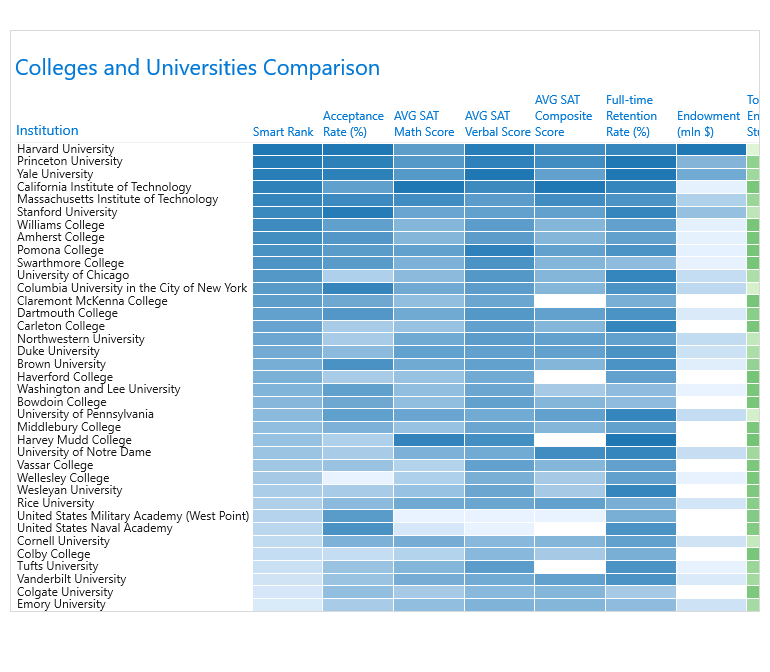
The HeatMap control for WinUI presents data in a two-dimensional table where values are denoted by different colors or hues of the same color to make it easier for the user to compare and indicate areas of interest as well as spot clusters of similar values across the set.
-
Populating with Data
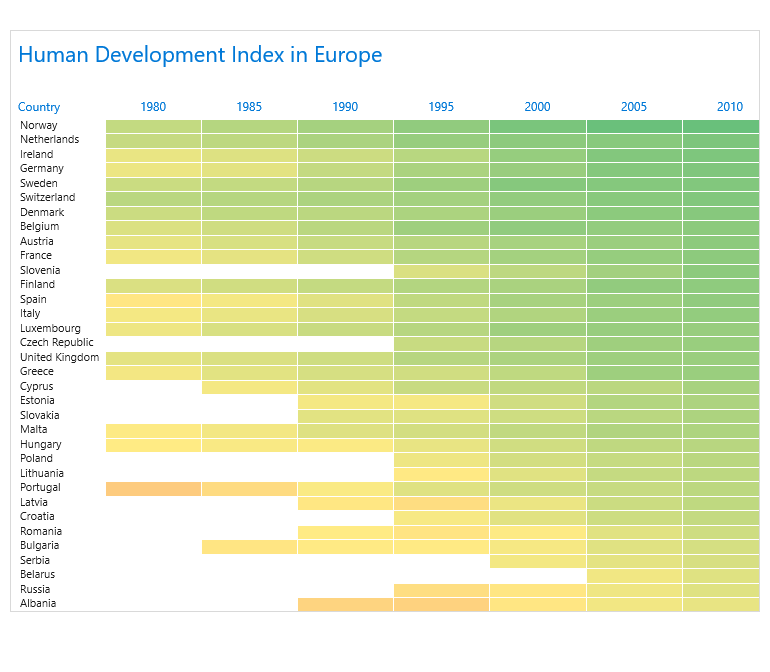
Set up the control with the familiar WPF binding mechanism by utilizing Categorical, Vertical or Horizontal definitions. . The categorical definition uses a single color for both rows and columns, while the Vertical and Horizontal definitions blend different colors into the colorizers. You can apply one of the built-in colorizers of preset colors or create your own.
-
Working With Large Datasets
When working with large datasets, the control exposes the capability to fine-tune the data fetching mechanism, boosting the performance and decreasing the memory footprint.
-
Colorizers
The control features a range of colorizers that define how the cells of the different values will be colored. The available colorizers include:
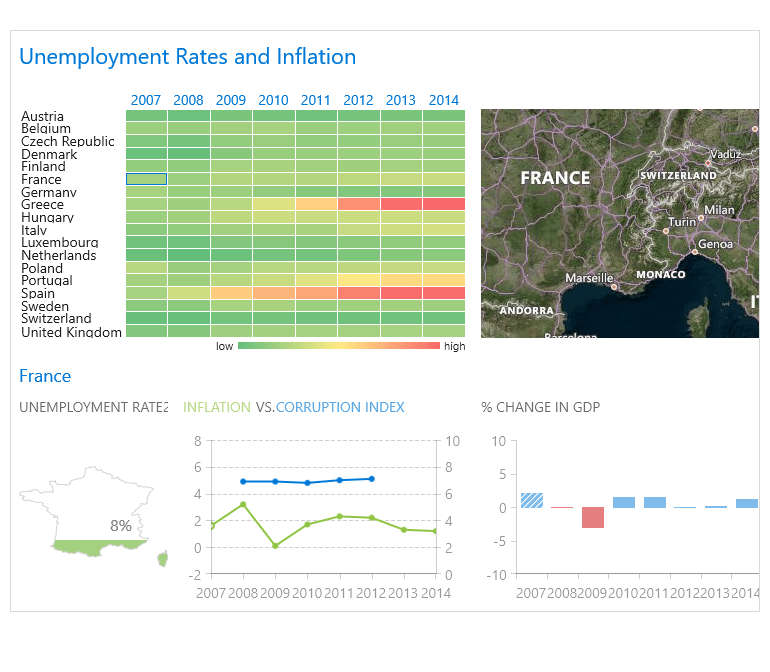
- Value Gradient Colorizer – uses gradient colors and gradient stops to pair different colors to the values in the range, gradually changing from one color to another as the values increase
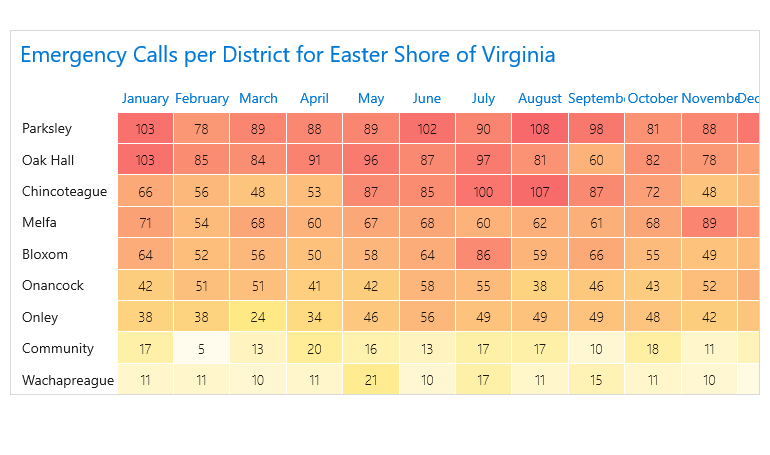
- Range Gradient Colorizer – uses different colors, making it easy to spot ranges of values
- Desaturation Colorizer – applies a level of desaturation to the provided start color with a predefined desaturation step
-
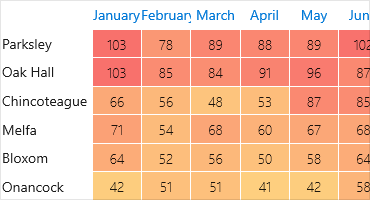
Labels
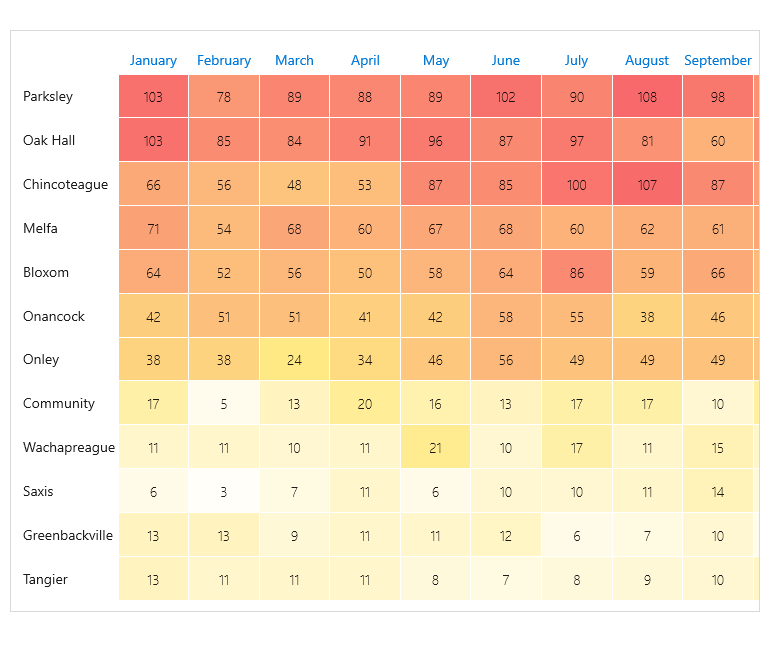
Each cell in the control can be configured to display labels with a predefined DataTemplate in order to allow the user to see what value goes with each cell.
-
Row and Column Headers
The row and columns headers in the Heap Map component expose various properties for customization of their position, style, string format, alignment, rotation and more.
-
Selection
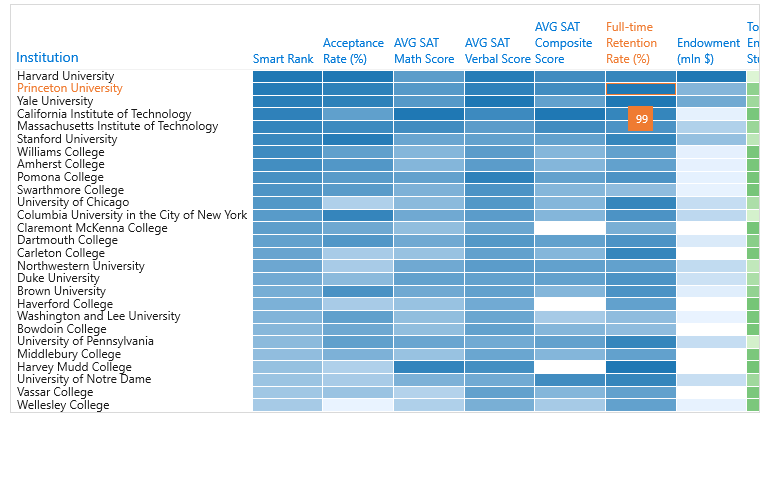
With the selection feature, the user can select a single or multiple cells in the controls, which will highlight the active cells border.
-
Tooltips
Highly customizable tooltip functionality is available, allowing you to provide additional information to the user when hovering over cells in the Heat Map component.